Monitoring OKE Cluster Processes with nmon: Capturing Granular Performance Data
Monitoring OKE Cluster Processes with nmon: Capturing Granular Performance Data
Introduction
When running workloads in Oracle Kubernetes Engine (OKE) clusters, having detailed visibility into system performance is crucial for troubleshooting issues, optimizing resources, and ensuring application reliability. While Kubernetes provides basic monitoring capabilities, capturing granular process-level metrics often requires specialized tools.
In this blog post, we’ll explore how to use nmon (Nigel’s Monitor) to capture detailed process information in OKE clusters. We’ll cover both production monitoring configurations (30-second intervals) and high-resolution troubleshooting setups (1-second intervals) for capturing granular metrics when investigating performance issues.
What is nmon?
nmon is a powerful system performance monitoring tool originally developed by IBM for AIX and later ported to Linux. It provides comprehensive insights into various system aspects:
- CPU utilization by core
- Memory usage
- Disk I/O activity
- Network throughput
- Top processes by resource usage
- File system statistics
- Kernel statistics
What makes nmon particularly valuable is its ability to monitor multiple system resources simultaneously, providing a consolidated view that helps identify correlations between different performance aspects. For example, you might notice that high CPU usage coincides with specific disk I/O patterns, pointing to potential bottlenecks.
Why Use nmon in OKE Clusters?
Kubernetes environments add layers of abstraction that can make performance troubleshooting challenging. Standard monitoring solutions often aggregate metrics over longer intervals (typically 15-60 seconds), which can mask short-duration spikes that impact application performance.
Key benefits of using nmon in OKE clusters include:
- Flexible monitoring resolution: Capture metrics at configurable intervals (30-60 seconds for production, 1 second for troubleshooting)
- Process-level visibility: Track specific processes and their resource consumption with the
-tflag - Low overhead: nmon is designed to be lightweight and consume minimal resources, especially at longer intervals
- Data persistence: Record performance data for offline analysis and historical comparison
- Visualization capabilities: Generate charts for easier interpretation of complex performance patterns
- Dynamic configuration: Switch between production and troubleshooting modes based on operational needs
Deployment Options for nmon in OKE
There are several approaches to deploying nmon in an OKE cluster. We’ll explore two primary methods:
- Standalone installation on individual nodes
- Containerized deployment using DaemonSets
Option 1: Standalone Installation
For direct installation on OKE nodes, you can use the following commands:
# Download nmon and nmonchart
curl -LO http://sourceforge.net/projects/nmon/files/nmonchart40.tar

# Create directory and extract
mkdir nmonchart
tar xvf nmonchart40.tar -C nmonchart

# Install ksh (required for nmonchart)
dnf install ksh

# Run nmon with 1-second interval
nmon -f -t -s 1 -c 3600  # Captures data for 1 hour with 1-second intervals
Option 2: Containerized Deployment (Recommended)
For Kubernetes environments, a containerized approach using DaemonSets provides better manageability and integration with the cluster. This ensures nmon runs on every node without manual installation.
Step 1: Create a Dockerfile for nmon
# Dockerfile
FROM oraclelinux:8

# Install EPEL
RUN yum install -y oracle-epel-release-el8.x86_64 && \
    yum install -y yum-utils && \
    yum-config-manager --enable ol8_baseos_latest ol8_appstream ol8_addons ol8_developer_EPEL

# Install nmon
RUN yum install -y nmon && \
    yum clean all

# Create a directory for nmon logs
RUN mkdir -p /var/log/nmon
RUN mkdir -p /opt/nmon/output

# Default command with 30-second interval for production monitoring
# Override with command in DaemonSet YAML for troubleshooting scenarios
ENTRYPOINT ["nmon", "-f", "-t", "-s", "30", "-c", "2880"]
Step 2: Build and Push the Docker Image
# Build the image
docker build -t nmon:oraclelinux8 .

# Tag the image for your registry
docker tag nmon:oraclelinux8 <your-registry>/nmon-repo:v1

# Log in to your registry
docker login -u '<username>' <your-registry>

# Push the image
docker push <your-registry>/nmon-repo:v1
Replace <your-registry>, <username> with your specific Oracle Cloud Infrastructure Registry details.
Step 3: Deploy nmon as a DaemonSet
Create a YAML file named nmon-daemonset.yaml:
apiVersion: apps/v1
kind: DaemonSet
metadata:
  name: nmon-daemonset
  namespace: monitoring  # Adjust as needed
  labels:
    k8s-app: nmon
spec:
  selector:
    matchLabels:
      name: nmon
  template:
    metadata:
      labels:
        name: nmon
    spec:
      # Tolerations to allow running on control-plane nodes if desired
      tolerations:
      - key: node-role.kubernetes.io/control-plane
        operator: Exists
        effect: NoSchedule
      - key: node-role.kubernetes.io/master
        operator: Exists
        effect: NoSchedule

      # Enable to see host processes
      hostPID: true
      containers:
      - name: nmon
        image: <your-registry>/nmon-repo:v1
        resources:
          limits:
            memory: 200Mi
          requests:
            cpu: 100m
            memory: 200Mi
        volumeMounts:
        - name: nmon-output
          mountPath: /opt/nmon/output
        - name: varlog
          mountPath: /var/log
        securityContext:
          privileged: true  # Required to access host metrics
      terminationGracePeriodSeconds: 30
      volumes:
      - name: nmon-output
        hostPath:
          path: /var/log/nmon
      - name: varlog
        hostPath:
          path: /var/log
Apply the DaemonSet configuration:
kubectl apply -f nmon-daemonset.yaml
Verify that the DaemonSet pods are running:
kubectl get pods -n monitoring
Configuring nmon for High-Resolution Metrics When Needed
nmon provides flexible configuration options that allow you to balance monitoring overhead with the level of detail needed for troubleshooting. The key to effective monitoring is understanding when to use different sampling intervals and which flags to enable.
Understanding nmon Command-Line Options
The core nmon parameters for data collection are:
-f: Write to a file instead of displaying interactively-t: Critical flag - Include top processes in the output (required for process-level troubleshooting)-s <seconds>: Sampling interval (how often to collect data)-c <count>: Number of samples to collect-p: Add extra process details including command arguments-T: Include top threads (helps identify specific threads causing high CPU usage)
Production Monitoring vs. High-Resolution Troubleshooting
For Production Monitoring (Continuous Operation):
Use longer intervals to minimize overhead while maintaining visibility:
# 30-second intervals for production monitoring (recommended)
nmon -f -t -s 30 -c 2880  # Captures 24 hours of data at 30-second intervals

# Alternative: 60-second intervals for lower overhead
nmon -f -t -s 60 -c 1440  # Captures 24 hours of data at 60-second intervals
For High-Resolution Troubleshooting (When Issues Occur):
When investigating performance issues, switch to high-resolution monitoring to capture granular details:
# 1-second intervals for detailed troubleshooting
nmon -f -t -s 1 -c 3600  # Captures 1 hour of data at 1-second intervals

# For very short incidents (5-10 minutes)
nmon -f -t -s 1 -c 600   # Captures 10 minutes of data at 1-second intervals
Critical Configuration: The -t Flag
Always include the -t flag when deploying nmon for troubleshooting. This flag is essential for capturing top processes, which is critical for identifying which processes are consuming resources during performance incidents.
Without -t, you’ll only get system-level metrics (CPU, memory, disk) but won’t be able to identify the specific processes causing issues. This is a common oversight that can significantly limit troubleshooting effectiveness.
Process-Level Visualizations (Requires -t Flag)
When you use the -t flag, nmonchart generates process-level visualizations that are essential for troubleshooting:
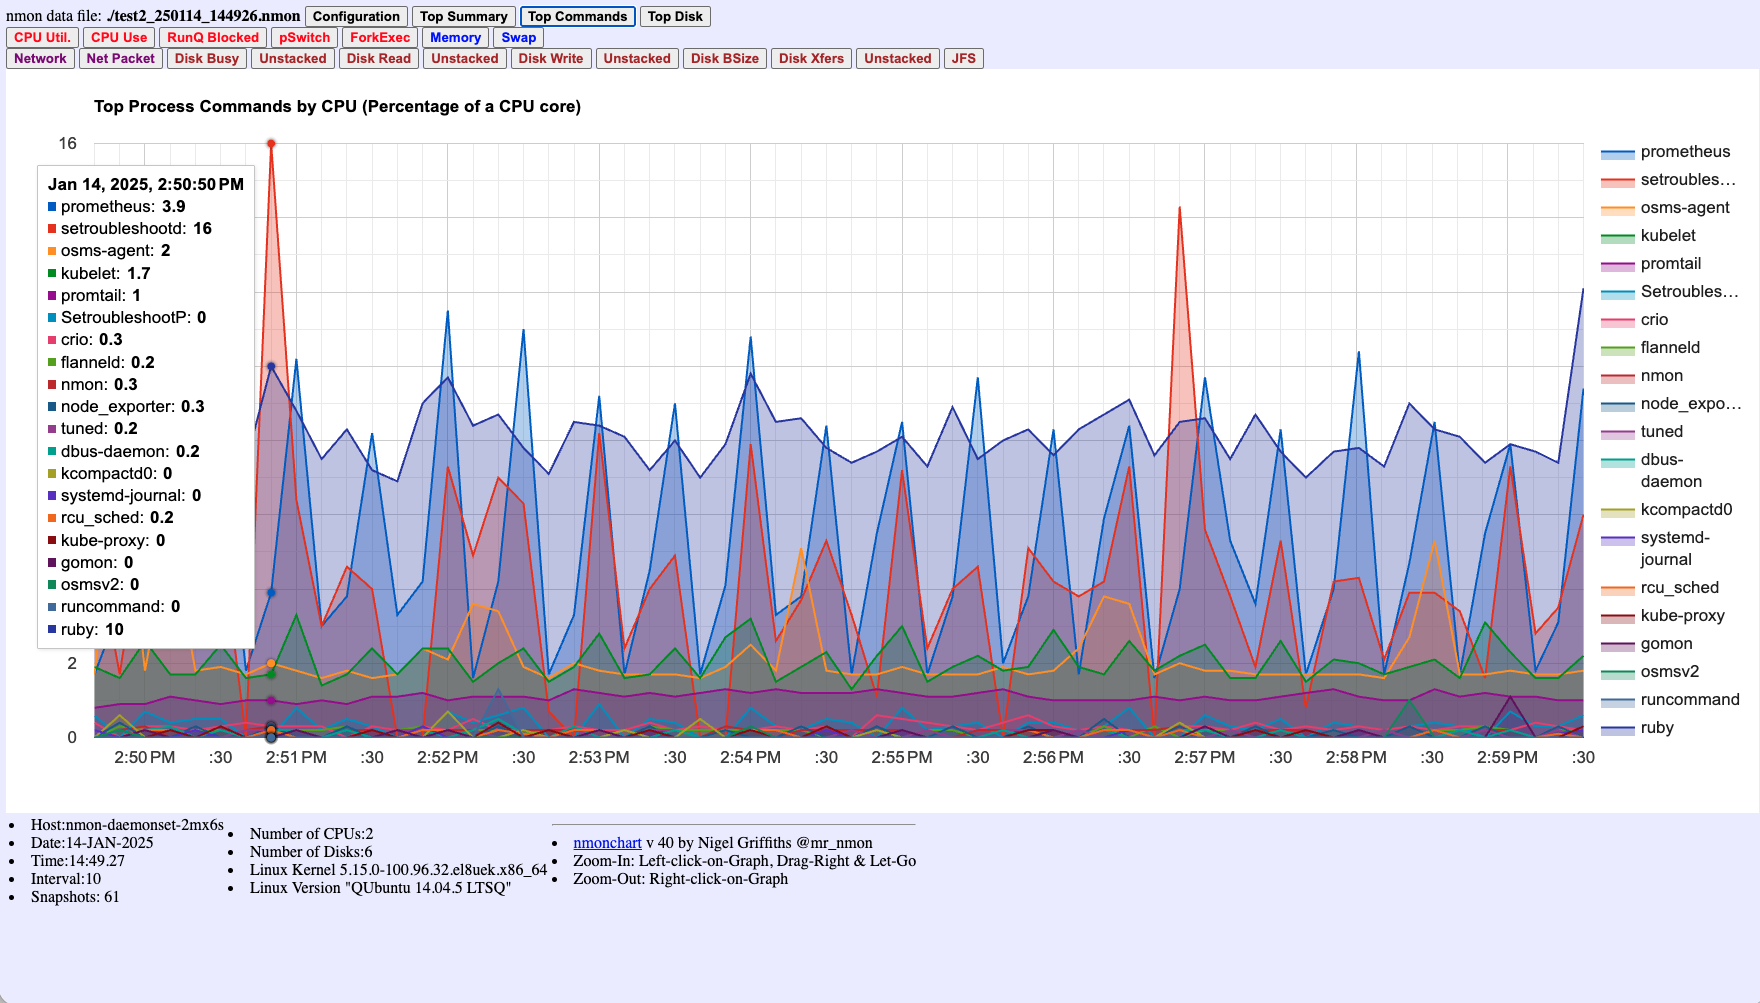
Figure 6: Top Process Commands by CPU percentage - critical for identifying which processes consume CPU resources. This chart clearly shows processes like setroubleshootd, prometheus, and ruby consuming CPU at specific times. This visualization is only available when using the -t flag - without it, you cannot identify which processes are causing performance issues.
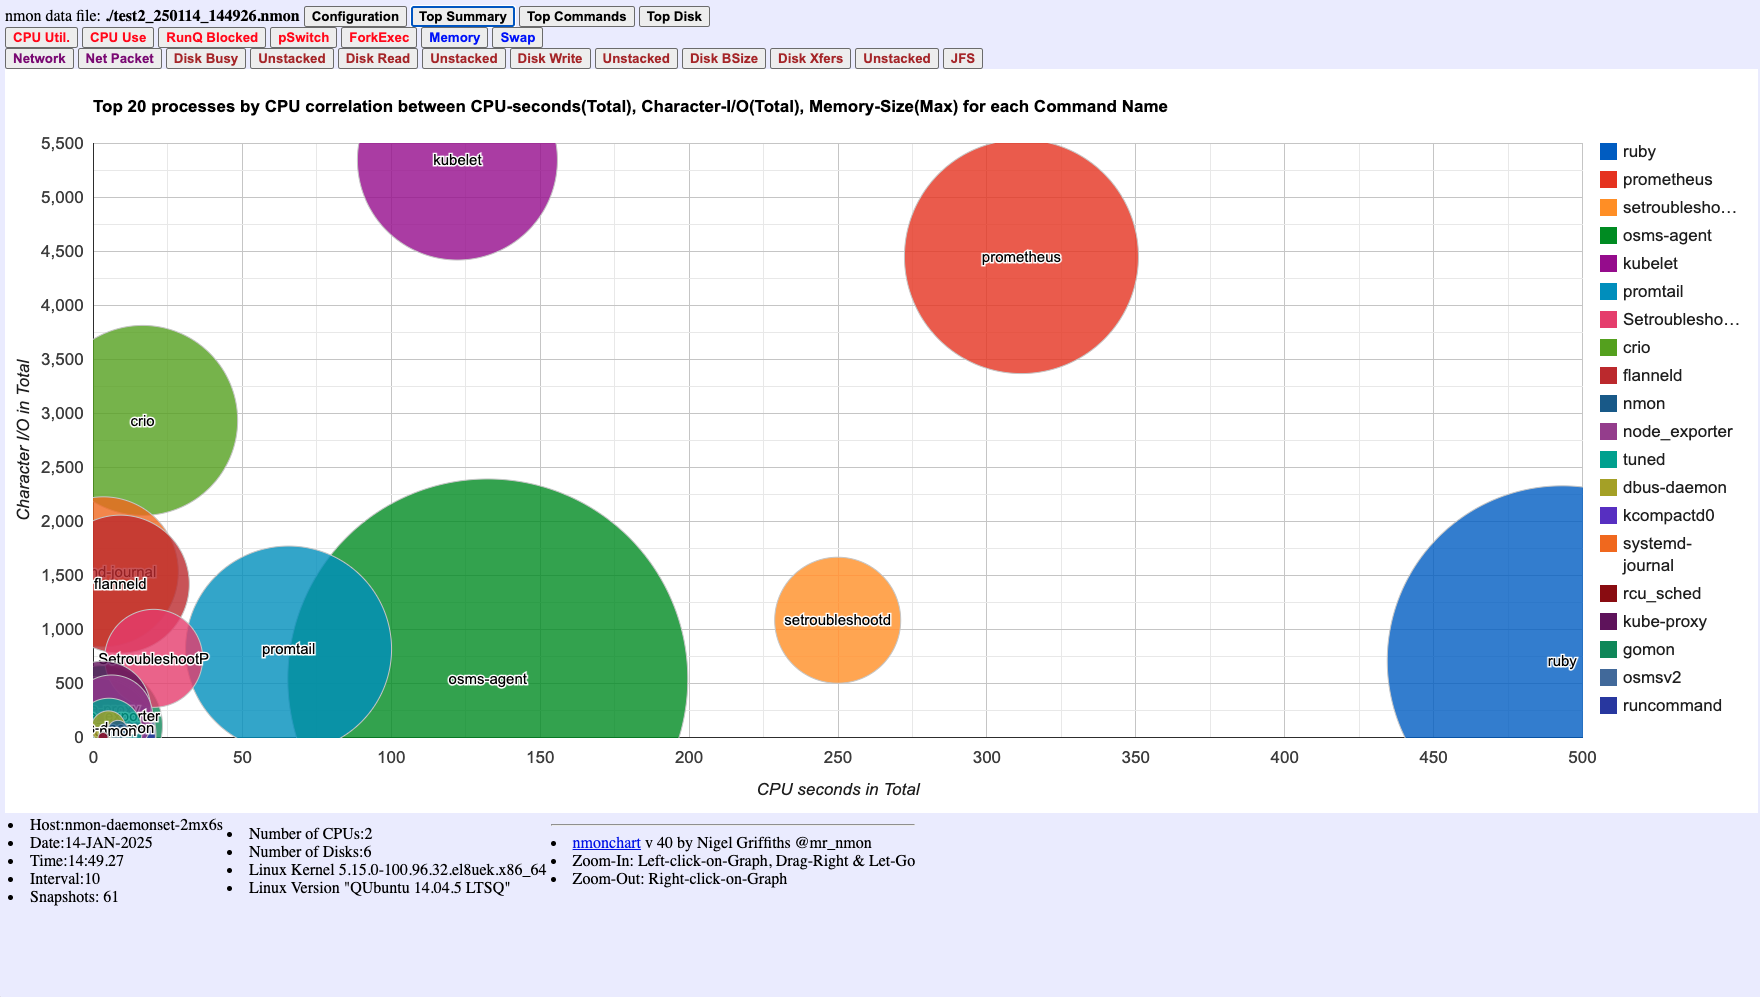
Figure 7: Top 20 processes correlation chart showing relationships between CPU seconds, Character I/O, and Memory Size. Bubble size represents memory consumption. This helps identify processes with high resource usage across multiple dimensions. Also requires the -t flag.
Critical Note: Without the -t flag, Figures 6 and 7 would not be available, making it impossible to identify which specific processes are causing performance issues. Always include -t when deploying nmon for troubleshooting.
Enhanced Troubleshooting Configuration
For comprehensive troubleshooting during critical incidents, use additional flags to capture maximum detail:
# Maximum detail configuration for troubleshooting
nmon -f -t -p -T -s 1 -c 1800  # 30 minutes of 1-second data with process and thread details

# Parameters explained:
# -f: File output
# -t: Top processes (REQUIRED for process identification)
# -p: Extra process details including command arguments
# -T: Top threads (identify specific threads causing high CPU)
# -s 1: 1-second sampling interval
# -c 1800: 1800 samples (30 minutes)
Dynamic Configuration Switching
In production environments, you can run nmon with normal intervals and dynamically switch to high-resolution mode when issues are detected:
Scenario: Intermittent CPU Spikes
- Normal Operation: Run nmon with 30-second intervals
nmon -f -t -s 30 -c 2880 -F /var/log/nmon/production_$(date +%y%m%d_%H%M%S).nmon - When Alert Detected: Immediately start high-resolution capture
# Execute in the nmon container/pod kubectl exec -n monitoring <nmon-pod-name> -- nmon -f -t -p -T -s 1 -c 300 -F /var/log/nmon/incident_$(date +%y%m%d_%H%M%S).nmon - Post-Incident Analysis: Collect both normal and high-resolution data files for comparison
Containerized Deployment Configuration
When deploying nmon as a DaemonSet, you can configure different behaviors for production vs. troubleshooting:
Production DaemonSet Configuration:
# Default command for production monitoring (30-second intervals)
ENTRYPOINT ["nmon", "-f", "-t", "-s", "30", "-c", "2880"]
Troubleshooting DaemonSet Configuration:
Create a separate DaemonSet or modify the existing one for incident response:
# In your DaemonSet YAML, you can override the command for troubleshooting
containers:
- name: nmon
  image: <your-registry>/nmon-repo:v1
  command: ["nmon", "-f", "-t", "-p", "-T", "-s", "1", "-c", "1800"]
  # ... rest of configuration
Or use environment variables for flexible configuration:
containers:
- name: nmon
  image: <your-registry>/nmon-repo:v1
  env:
  - name: NMON_INTERVAL
    value: "1"  # Change to 30 for production
  - name: NMON_COUNT
    value: "1800"  # Adjust based on monitoring duration needed
  - name: NMON_FLAGS
    value: "-t -p -T"  # Include top processes, process details, and threads
  command: ["/bin/sh", "-c", "nmon -f $NMON_FLAGS -s $NMON_INTERVAL -c $NMON_COUNT"]
Real-World Example: Capturing Process Information During CPU Spikes
Based on production experience with OKE clusters experiencing intermittent CPU spikes:
Problem: CPU spikes lasting less than a minute causing hundreds of alerts, but standard monitoring couldn’t identify the root cause.
Solution: Deploy nmon with proper configuration:
# Deploy nmon DaemonSet with 30-second intervals for continuous monitoring
kubectl apply -f nmon-daemonset-production.yaml

# When CPU spike is detected, immediately capture high-resolution data
kubectl exec -n monitoring <nmon-pod-name> -- nmon -f -t -p -s 1 -c 300 -F /opt/nmon/output/spike_$(date +%y%m%d_%H%M%S).nmon
Key Learning: The -t flag is essential. Without it, you’ll capture system metrics but won’t be able to identify which processes are consuming CPU during the spike.
Configuration Best Practices
-
Always use
-tflag: This is non-negotiable for troubleshooting. It enables process-level visibility. - Match interval to problem duration:
- For issues lasting seconds: Use 1-second intervals
- For issues lasting minutes: 5-10 second intervals may suffice
- For continuous monitoring: 30-60 second intervals
-
Balance data volume with detail: Higher resolution generates more data. Plan storage accordingly.
-
Use
-pand-Tselectively: These flags add overhead. Use them during active troubleshooting, not for continuous monitoring. - File naming convention: Use descriptive names with timestamps for easy identification:
nmon -f -t -s 1 -c 600 -F /var/log/nmon/cpu_spike_$(date +%y%m%d_%H%M%S).nmon
Analyzing nmon Data
nmon generates files with the .nmon extension, which contain all the collected metrics in a CSV-like format. There are several ways to analyze this data:
Option 1: Using nmonchart (Recommended for Visual Analysis)
The simplest and most effective approach is to use the included nmonchart tool to generate interactive HTML-based charts:
./nmonchart/nmonchart hostname_date_time.nmon
# Creates: hostname_date_time.html
This generates an interactive HTML file with comprehensive performance visualizations. The following sections show examples of the key charts available:
CPU Utilization Chart
The CPU utilization chart shows how CPU resources are distributed across different categories:
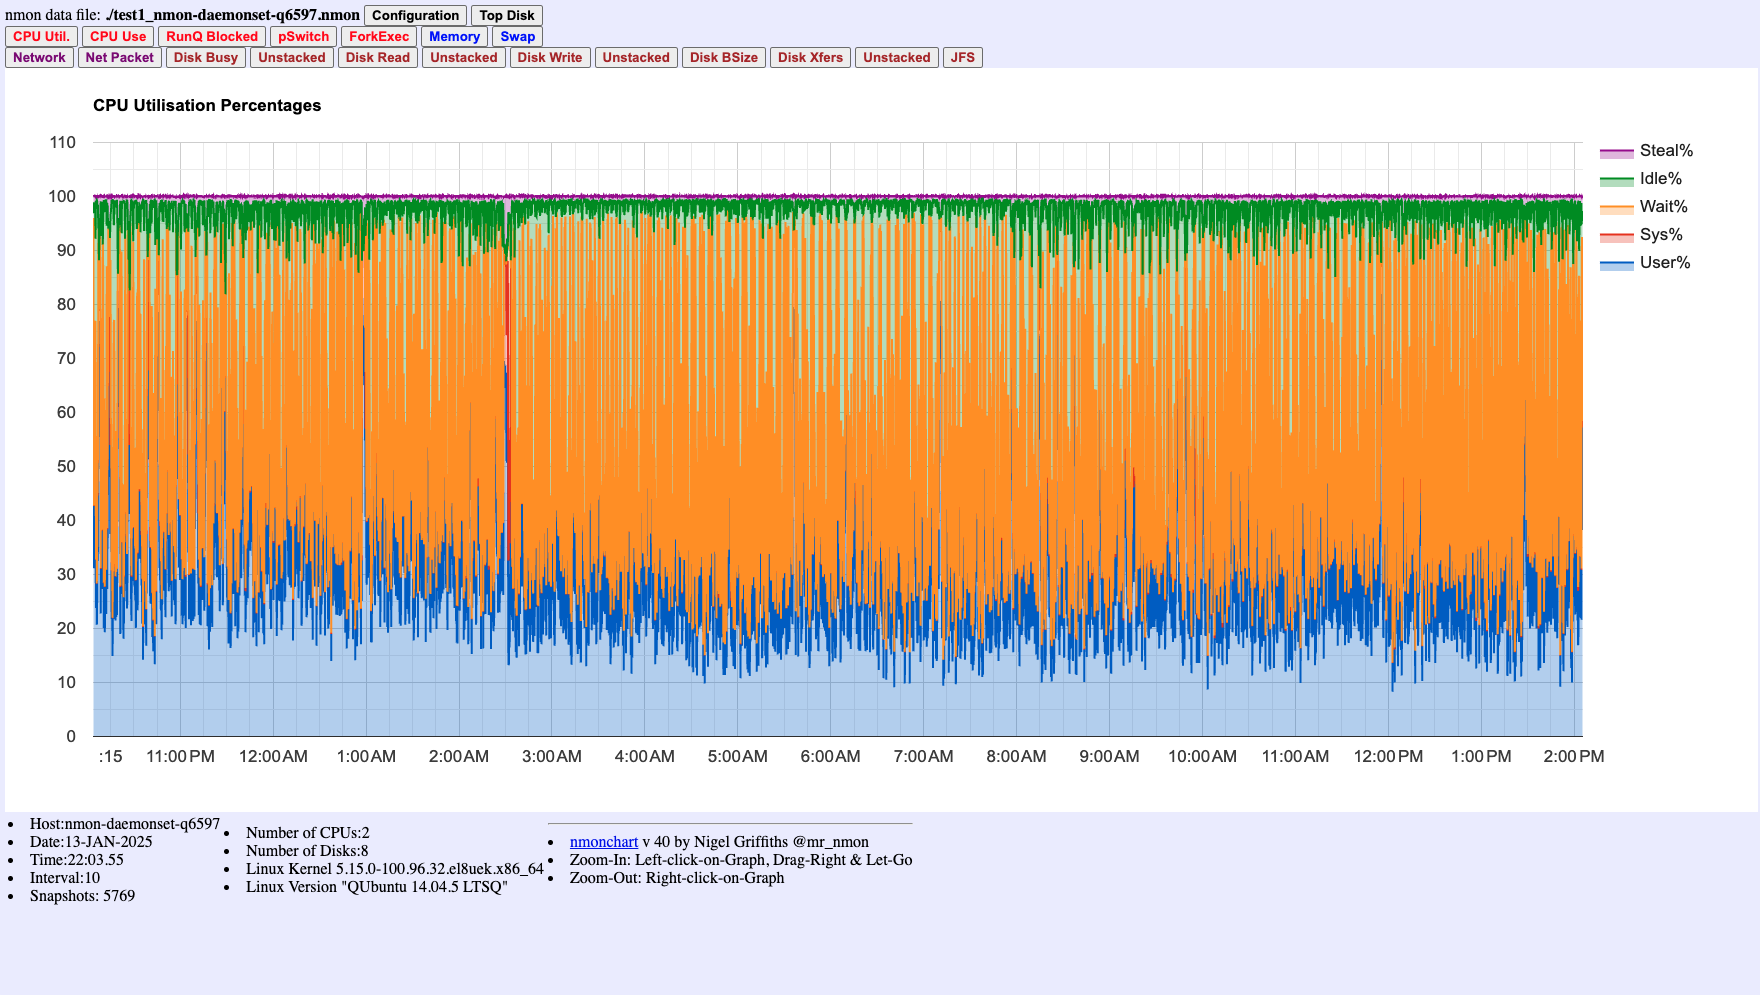
Figure 1: CPU Utilization Chart showing User%, System%, Wait%, Idle%, and Steal% over time. High Wait% (orange area) indicates I/O bottlenecks. This example shows data collected at 10-second intervals - use 1-second intervals for troubleshooting incidents.
Memory Usage Chart
The memory chart displays RAM utilization breakdown:
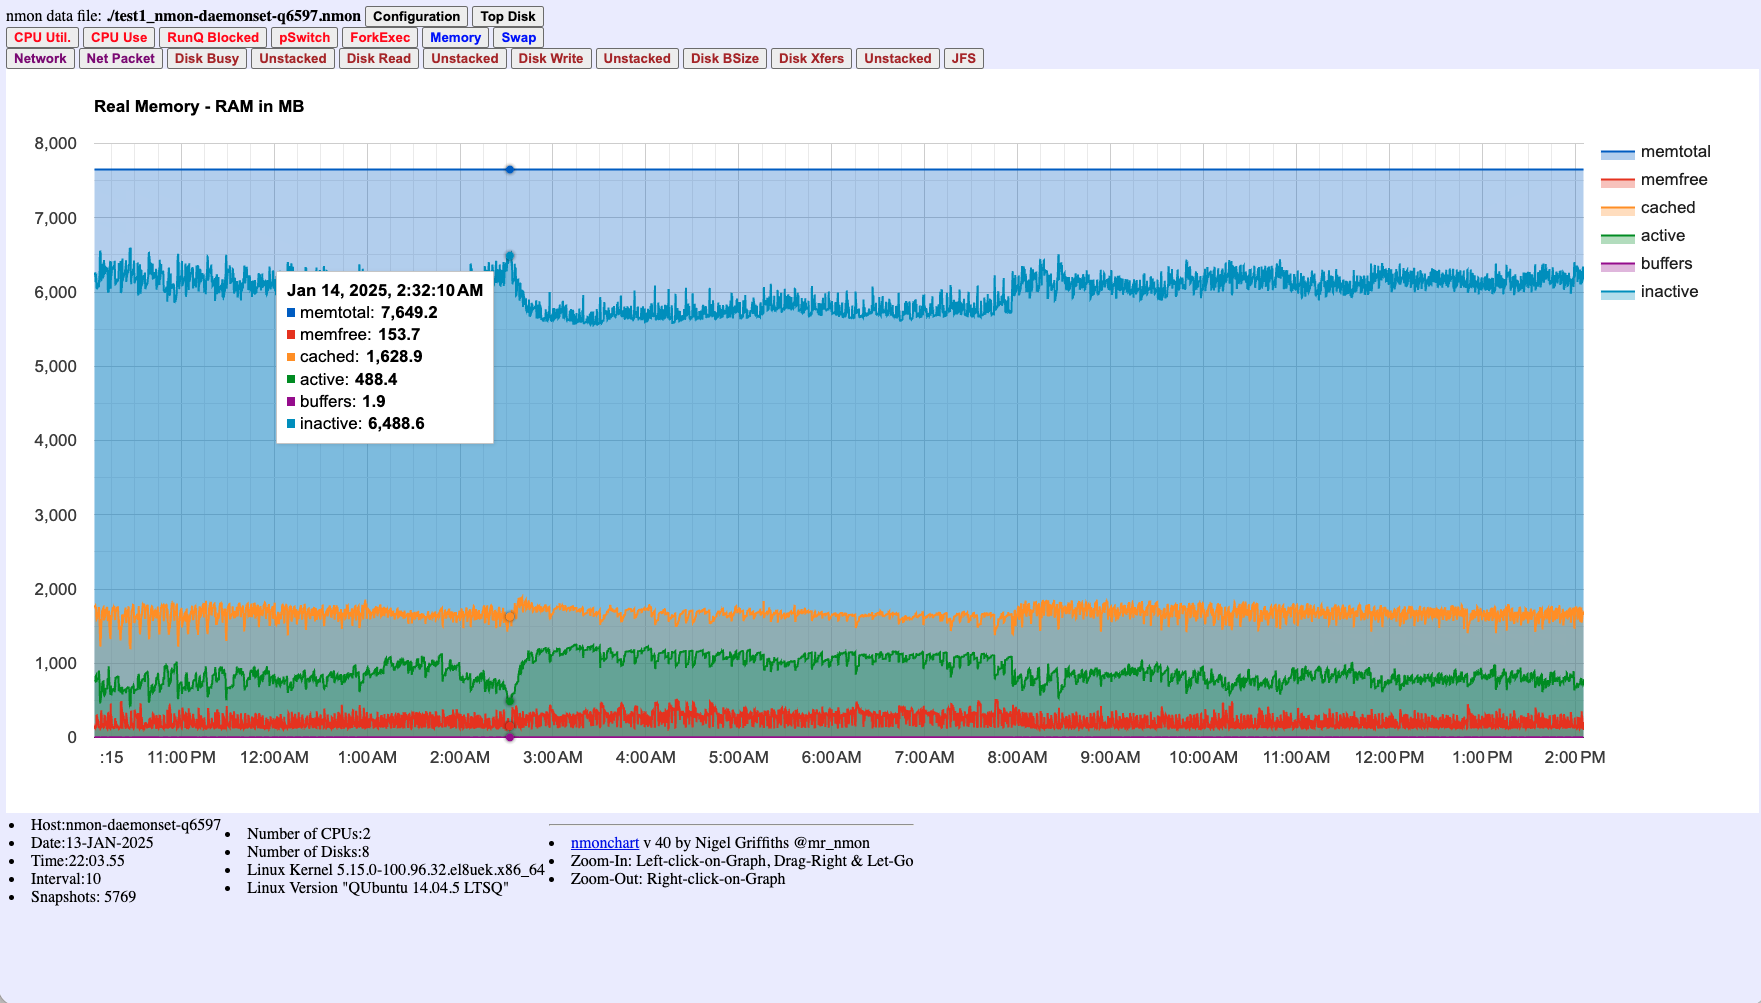
Figure 2: Real Memory (RAM) breakdown showing total, free, cached, active, buffers, and inactive memory over time. Helps identify memory pressure that might correlate with performance issues.
Disk I/O Charts
Disk charts help identify I/O bottlenecks:
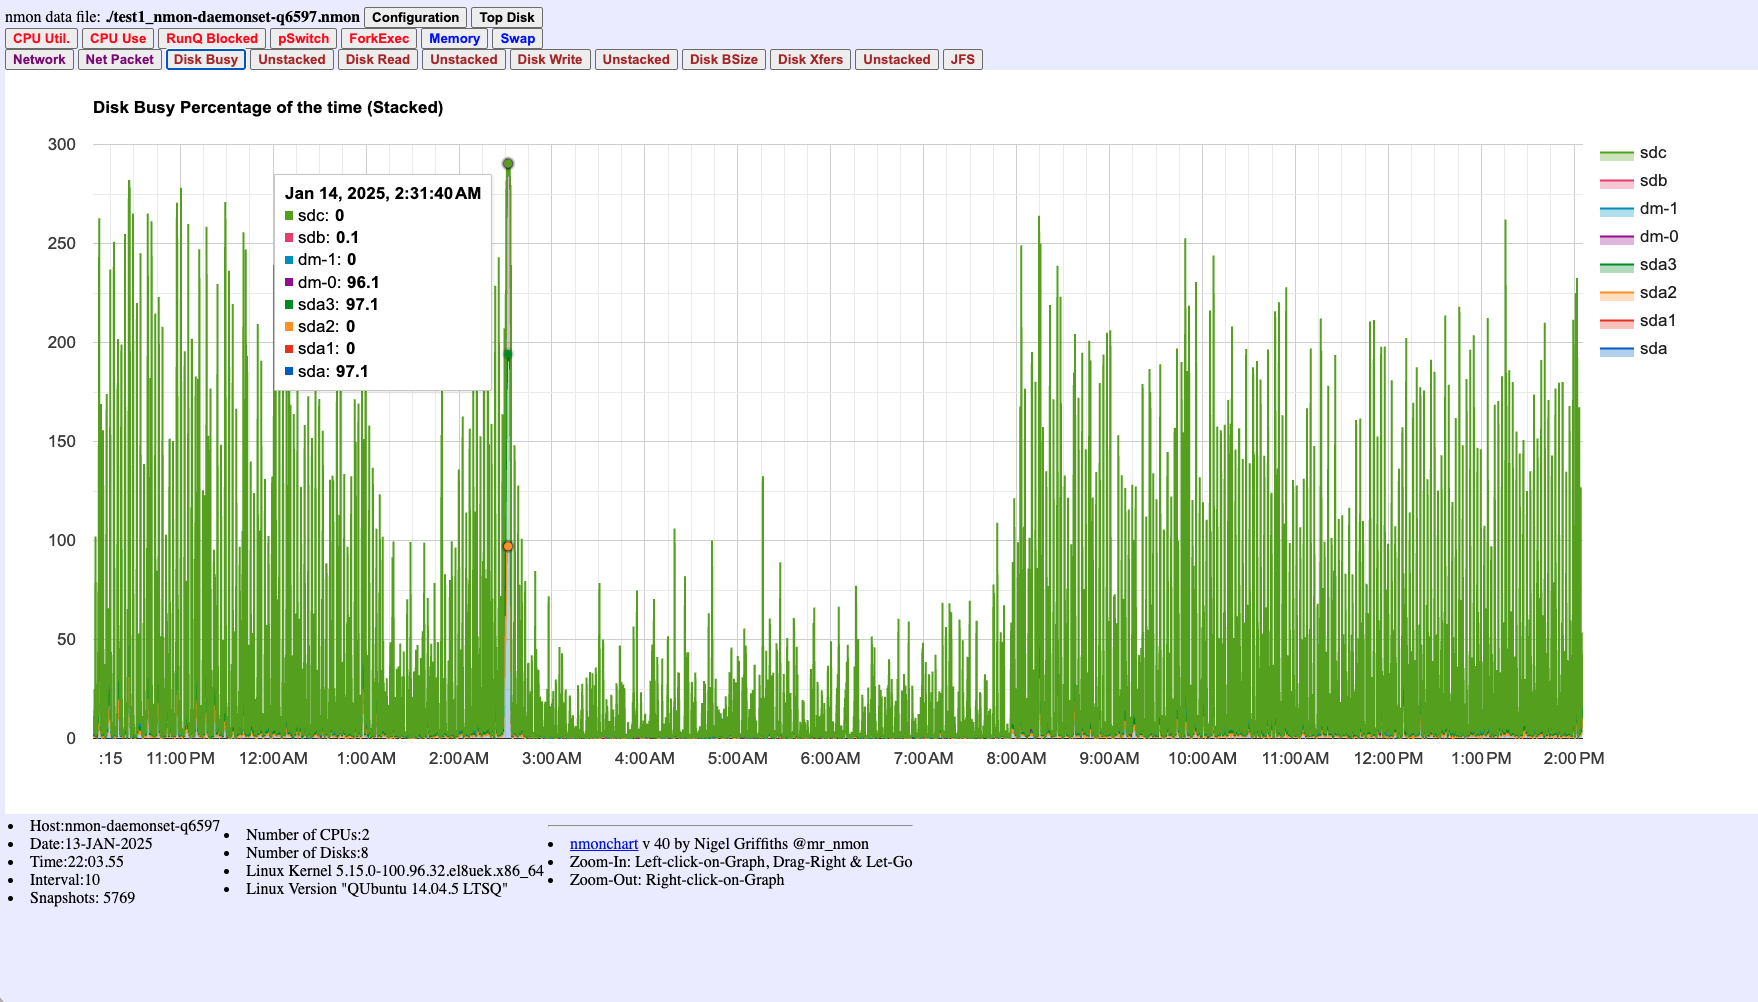
Figure 3: Disk Busy Percentage (stacked) showing activity across multiple disk devices. High values indicate disk I/O bottlenecks.
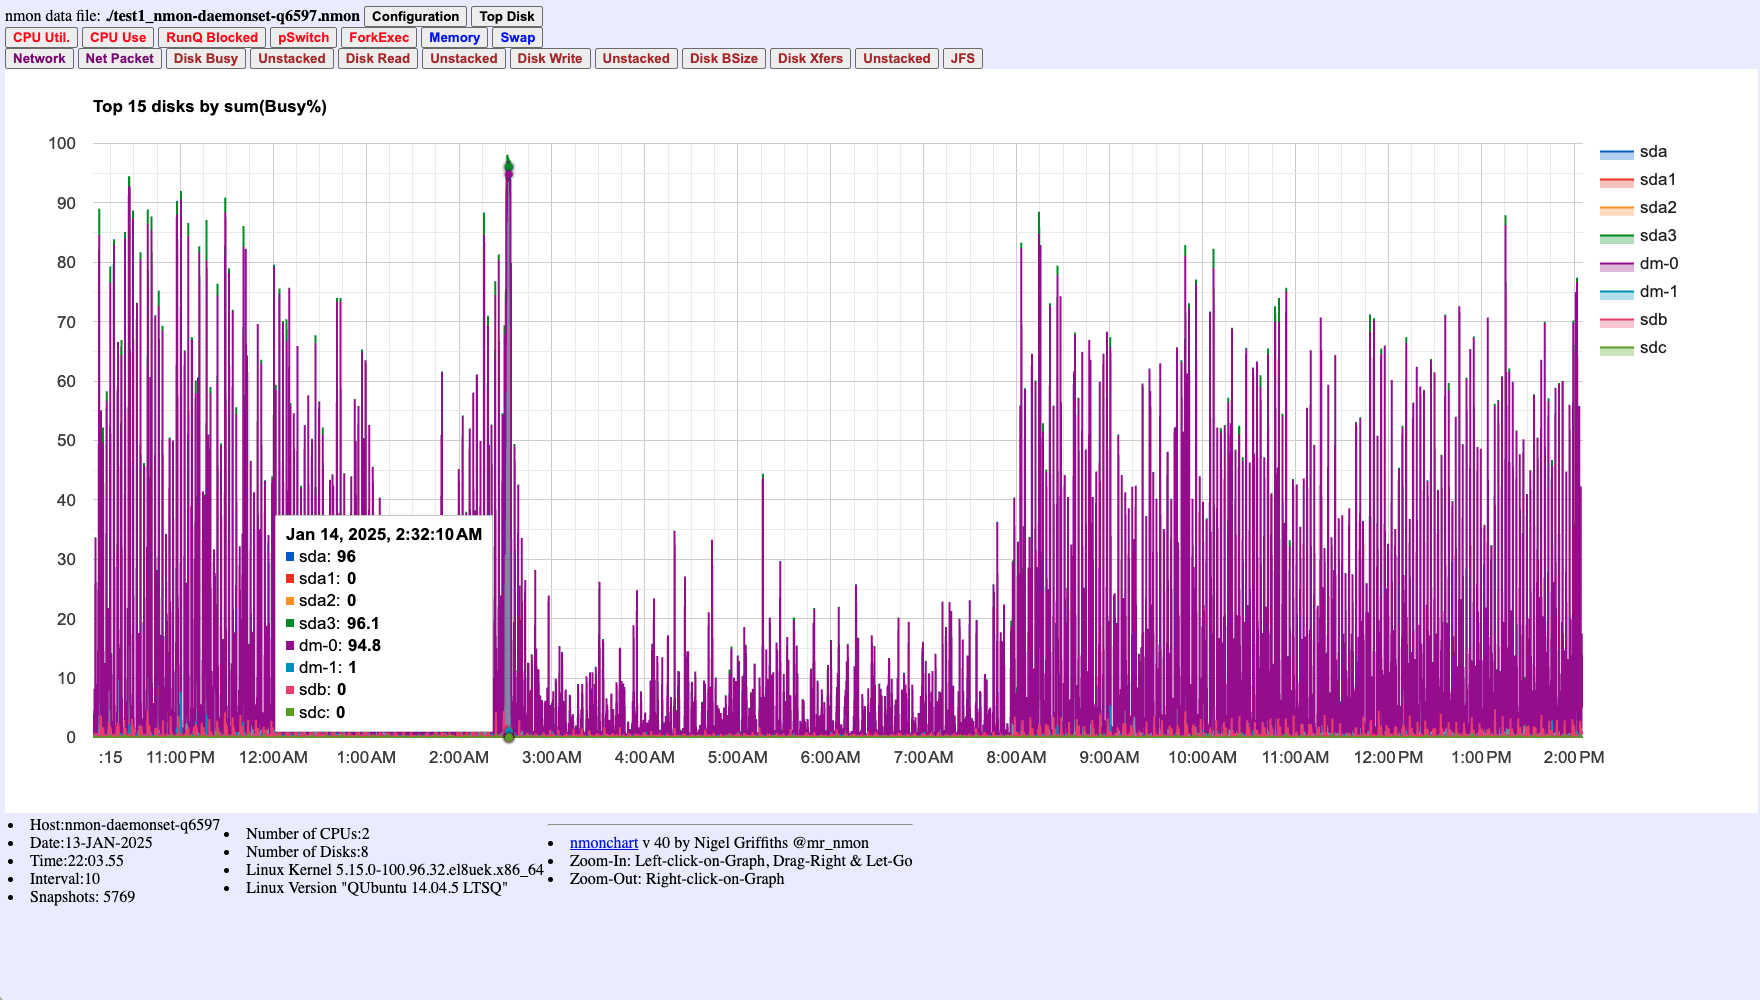
Figure 4: Top 15 disks by Busy% - identifies which specific disks are experiencing the highest utilization.
Run Queue Chart
The run queue chart shows process scheduling activity:
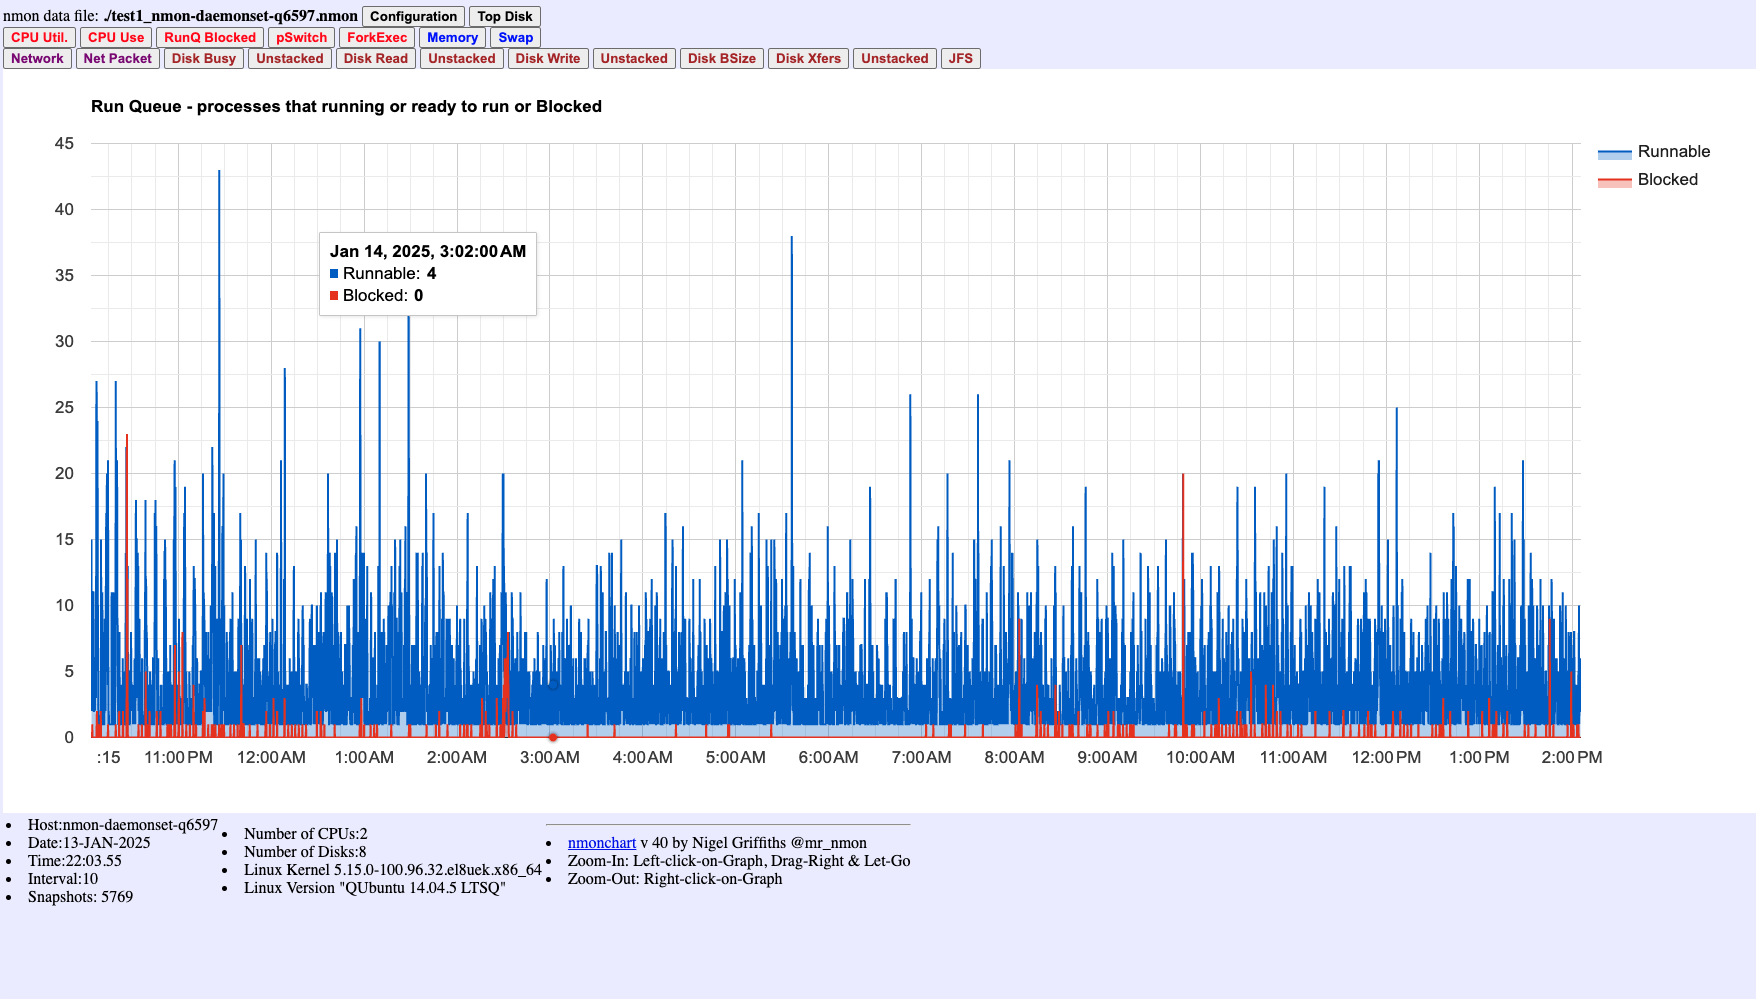
Figure 5: Run Queue showing Runnable (blue) and Blocked (red) processes. High runnable counts indicate CPU contention where many processes are competing for CPU time.
Key Features of nmonchart Visualizations:
- Time-series Analysis: All charts are time-aligned, making it easy to correlate events across different metrics
- Interactive Navigation: Scroll through the HTML to view different time periods and metrics
- Configuration Summary: The HTML includes system configuration details (CPU count, memory, disk layout) captured at collection time
Option 2: Custom Analysis with nmon2csv
For more advanced analysis, you can convert nmon data to CSV format and process it with tools like Python, R, or Excel:
# Install nmon2csv (if not already available)
pip install nmon2csv

# Convert nmon data to CSV
nmon2csv hostname_date_time.nmon
Option 3: Integration with Monitoring Platforms
For persistent monitoring, you can integrate nmon data with platforms like Prometheus and Grafana:
- Use a sidecar container to process nmon output
- Expose metrics in Prometheus format
- Create Grafana dashboards for visualization
Use Case: Identifying CPU-Intensive Processes During Intermittent Spikes
Let’s walk through a real-world use case: identifying CPU spikes in an OKE cluster that last less than a minute.
Scenario Setup
Initial State: nmon DaemonSet running with 30-second intervals for continuous production monitoring.
Incident: Intermittent CPU spikes detected, causing hundreds of alerts but standard monitoring cannot identify root cause.
Investigation Steps
- Deploy nmon for Production Monitoring (if not already running)
# Deploy with 30-second intervals for continuous monitoring kubectl apply -f nmon-daemonset.yaml - When CPU Spike is Detected: Immediately switch to high-resolution capture
# Execute high-resolution capture in the running nmon pod kubectl exec -n monitoring <nmon-pod-name> -- nmon -f -t -p -s 1 -c 300 -F /opt/nmon/output/spike_$(date +%y%m%d_%H%M%S).nmonCritical: Ensure the
-tflag is included to capture top processes. Without this flag, you’ll only see system-level metrics and won’t be able to identify the problematic processes. - Collect nmon Files after the incident
# Copy nmon files from the pod kubectl cp monitoring/<nmon-pod-name>:/opt/nmon/output/spike_*.nmon ./incident_data.nmon - Generate Visualizations using nmonchart
./nmonchart/nmonchart incident_data.nmon # Opens incident_data.html in your browser - Analyze Visualizations: Review the HTML charts to identify the issue
- CPU Chart (Figure 1): Locate the spike time window and check Wait% for I/O bottlenecks
- Run Queue Chart (Figure 5): Check for high runnable processes indicating CPU contention
- Top Processes Section (Figure 6): Identify which processes consumed CPU during the spike - requires
-tflag - Memory Chart (Figure 2): Check if memory pressure coincided with CPU spike
- Disk I/O Charts (Figures 3-4): Determine if disk I/O was a contributing factor
- Process Correlation (Figure 7): Review bubble chart for multi-dimensional resource analysis
- Extract Process Details from raw nmon data (if needed for further analysis)
# Extract top processes during the spike period grep "^TOP" incident_data.nmon | tail -50 # Look for processes with high CPU usage grep "^TOP" incident_data.nmon | grep -E "CPU.*[5-9][0-9]|CPU.*100" - Identify Root Cause: Correlate findings from visualizations (Figures 1-7) with application logs and system events
Key Success Factors
- The
-tflag is essential: Without it, process identification is impossible - High-resolution timing: 1-second intervals capture short-lived spikes that 30-second intervals miss
- Immediate response: Start high-resolution capture as soon as the issue is detected
- Process details: The
-pflag provides command arguments that help identify specific application components
Example Output Analysis
When analyzing nmon data, look for patterns like:
TOP,CPU%,Mem%,Pid,Command
TOP,45.2,2.1,12345,/usr/bin/java -Xmx2g MyApplication
TOP,32.1,1.5,12346,/usr/bin/kubelet --config=/etc/kubernetes/kubelet.conf
This shows that a Java application process (PID 12345) is consuming 45.2% CPU during the spike, which would be missed with standard monitoring intervals.
When visualized using nmonchart (see Figure 6), you can see this process activity clearly in the Top Process Commands chart. The 1-second granularity allows you to catch short-lived spikes that might be missed with standard monitoring intervals, while the -t flag ensures you can identify exactly which processes are responsible.
Correlating Charts for Root Cause Analysis:
When analyzing performance incidents, correlate findings across multiple charts:
- High CPU Wait% (Figure 1) + High Disk Busy% (Figures 3-4) = I/O bottleneck
- High Runnable processes (Figure 5) + High CPU User% (Figure 1) = CPU contention
- Specific process CPU spikes (Figure 6) + Memory pressure (Figure 2) = Process-specific resource issue
- Process correlation (Figure 7) helps identify processes with high resource usage across multiple dimensions
Best Practices for nmon in OKE
- Configuration Strategy:
- Use 30-second intervals for continuous production monitoring to balance detail with overhead
- Switch to 1-second intervals only when troubleshooting active incidents
- Always include the
-tflag to capture top processes (critical for troubleshooting)
- Resource considerations:
- While nmon is lightweight, 1-second intervals generate significantly more data than 30-second intervals
- Monitor the resource usage of nmon itself, especially during high-resolution captures
- Plan storage capacity based on your monitoring intervals and retention requirements
- Data retention:
- Implement a rotation policy for nmon files to prevent disk space issues
- Archive high-resolution troubleshooting captures separately from routine monitoring data
- Consider compressing older nmon files to save space
- Security context:
- The nmon container requires privileged access to gather all metrics
- Consider your security requirements and use least-privilege principles where possible
- Review and restrict access to nmon output files containing system information
- Selective deployment:
- You may not need nmon on every node
- Consider using node selectors to deploy only to nodes of interest
- For troubleshooting, you can deploy to specific nodes experiencing issues
- Process visibility:
- Always use
-tflag: This is the most critical flag for troubleshooting. Without it, you cannot identify which processes are consuming resources - Use
-pflag during active troubleshooting to get command arguments for better process identification - Use
-Tflag when investigating thread-level issues
- Always use
- Integration with alerting:
- Automate the analysis of nmon data to trigger alerts on abnormal patterns
- Set up automated high-resolution capture when critical alerts are triggered
- Correlate nmon data with application and infrastructure logs for comprehensive analysis
- Troubleshooting Workflow:
- Establish baseline metrics with normal interval monitoring
- When issues occur, immediately switch to high-resolution capture
- Document the configuration used during each troubleshooting session
- Review and refine your monitoring strategy based on incident patterns
Conclusion
nmon provides a powerful and flexible way to capture performance data in OKE clusters, helping identify and troubleshoot issues that might be missed with standard monitoring solutions. By deploying nmon as a DaemonSet with appropriate configuration for your use case, you gain detailed visibility into process behavior across your cluster.
Key Takeaways:
- Use appropriate intervals: 30-second intervals for production monitoring, 1-second intervals for active troubleshooting
- Always include the
-tflag: This is critical for capturing top processes and identifying resource-consuming applications - Dynamic configuration: Switch to high-resolution mode when investigating incidents, then return to normal monitoring
- Process identification: The combination of
-t,-p, and-Tflags provides comprehensive process and thread-level visibility
This approach complements existing monitoring solutions, providing the flexibility to capture high-resolution data when needed while maintaining efficient continuous monitoring during normal operations. The ability to dynamically adjust monitoring resolution based on operational needs makes nmon an invaluable tool for troubleshooting complex performance issues in OKE environments.