Beyond the Fusion Metrics: Monitoring Oracle Fusion Business APIs
Beyond the Fusion Metrics: Monitoring Oracle Fusion Business APIs
A customer-inspired performance-monitoring pattern with OCI Application Performance Monitoring
This new monitoring paradigm grew out of a customer request to test the Oracle Fusion REST APIs that their business integrations depend on, with synthetic monitoring as the next step. It offers a way to check API availability and expected responses even when integration traffic is quiet.
That request points to a useful design shift for Fusion monitoring: organize checks around business API capabilities. An item lookup, an inventory query, or a work-order request gives availability a meaning that an integration team can act on. Each check combines an authenticated request, a small set of known test records, and explicit response assertions.
The customer request supplied the starting point, but the pattern applies more broadly. Fusion customers can choose the API capabilities on which their own processes depend, then check those capabilities from the locations and at the frequency that matter to them. In a broader Fusion observability approach, these outside-in API checks belong in the Performance pillar: they measure whether a selected business API responds correctly and how long the synthetic operation takes. Real User Monitoring for Oracle Fusion SaaS Cloud Apps examines the complementary experience of people using the Fusion interface, while ESS log collection and ESS, audit, and security dashboards show other operational and security signals. This pillar framing describes how to organize the monitoring design; it is not an OCI product category.
This post extends Fusion monitoring beyond native metrics by asking whether a selected, authenticated business API returns the expected data within an acceptable time from a chosen vantage point. Using OCI Application Performance Monitoring (APM) Availability Monitoring, we show how to create Scripted REST checks, configure where and when they run, and visualize availability, execution time, and failure trends. Items, inventories, work centers, and work orders illustrate scoped GET checks; a read-only batch shows how to test POST without changing business records. Together, these examples give Fusion teams a pattern they can adapt to their own critical integrations while keeping customer-specific workflows and records private.
Reference architecture: Fusion business APIs and APM Availability Monitoring
In OCI APM, these synthetic checks are configured under Availability Monitoring. APM schedules the monitor, a selected execution location sends requests to Fusion, and the results return to APM for analysis. Requests originate at the vantage point; this outside-in design needs no monitoring agent inside Fusion. The architecture connects each business API capability to a repeatable availability check. Use Availability Monitoring
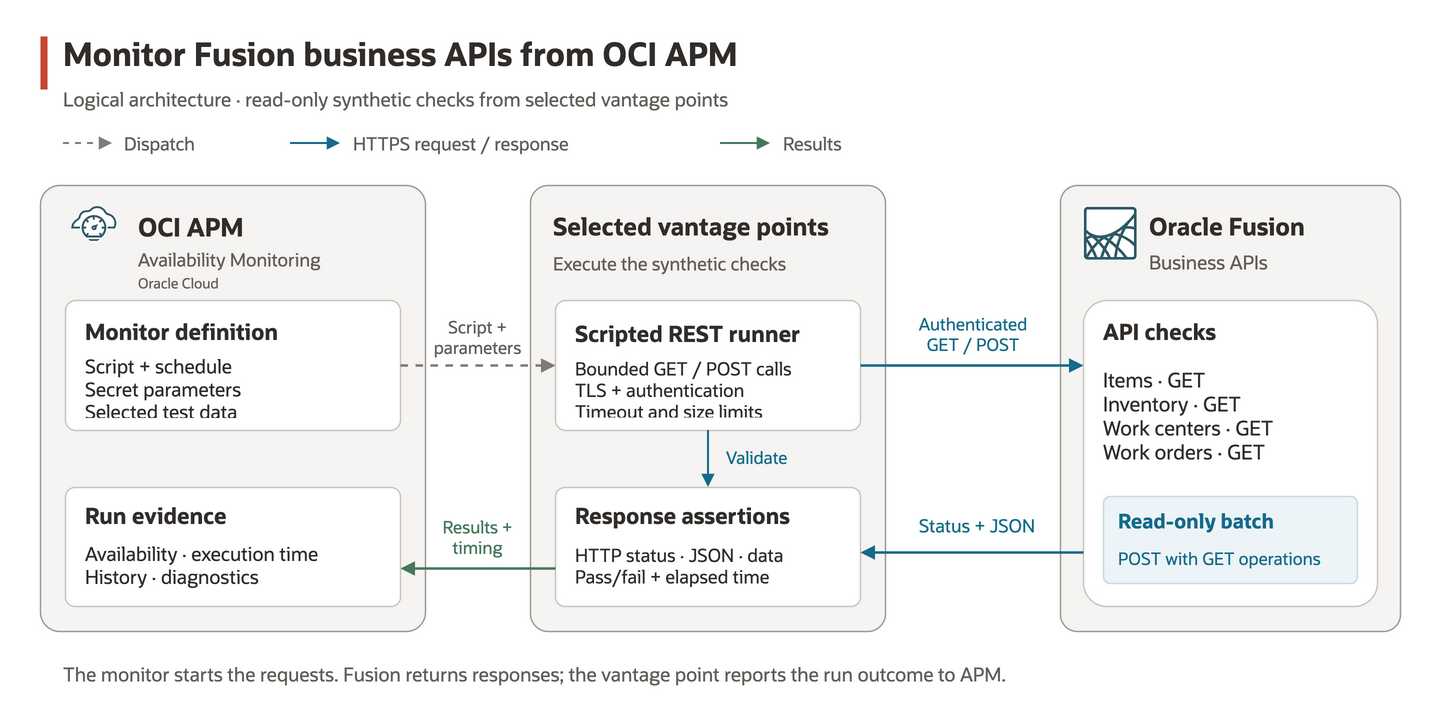
Figure 1. Reference architecture for Fusion Business API endpoint monitoring via OCI APM.
The components have distinct responsibilities:
| Component | Role in this design |
|---|---|
| APM domain and Availability Monitoring | Organize scripts and monitors, schedule executions, and expose run history and metrics. |
| Scripted REST script | Define the HTTP requests, authentication headers, response assertions, and optional timing markers in JavaScript. |
| Monitor | Associate a script with parameter values, execution locations, frequency, timeout, and availability settings. One script can be reused with different monitor configurations. |
| Vantage point | Run the script, call Fusion over HTTPS, evaluate the responses, and report the outcome. |
| Fusion business APIs | Serve the authenticated requests using the monitoring account’s access and selected test records. |
| Metrics, history, and dashboards | Show availability and timing trends, locate failed executions, and connect observations to a monitor and location. |
For a scripted monitor, the script defines what to test; the monitor defines how and where it runs. For example, an items script contains the lookup and assertions, while a monitor named fusion_items supplies the pod, test values, schedule, and locations.
Choose the monitor type for the test
Availability Monitoring provides several monitor types, each suited to a different kind of test:
| Monitor type | What it tests |
|---|---|
| Browser | Loads one web page in a browser to measure page performance and check its response. |
| Scripted Browser | Runs a recorded browser workflow, such as signing in and navigating through a user transaction. |
| REST | Sends a single GET or POST request with configured authentication and response validation. |
| Scripted REST | Runs JavaScript-defined API requests, sequencing, and custom response assertions. |
| Network | Checks host reachability and network performance using TCP or ICMP probes. |
| DNS | Tests DNS resolution, delegation, or DNSSEC validation. |
| SQL | Executes a SELECT query against a reachable supported database and measures its performance. |
| FTP | Tests file listing, upload, or download over FTP, FTPS, or SFTP. |
Oracle’s monitor type and configuration documentation describes the settings for each type. SQL monitoring requires an accessible database; a Fusion REST endpoint does not provide that database connection.
We use Scripted REST because this API testing use case needs queries built from test values, validation of returned JSON and batch parts, and timing around named operations. JavaScript gives the check control over those requests and assertions. The REST monitor also supports POST; the reason for choosing Scripted REST here is the programmable test logic. Browser monitors suit checks of the Fusion user interface.
What is a vantage point?
A vantage point is where APM runs a monitor and sends its requests. Oracle provides public locations in OCI data centers and in external data centers; the locations labeled External are part of that public offering. You can also run monitors from locations you operate in your tenancy or on a VM in another network. Oracle APM vantage-point overview
| Vantage point | Where the check runs | When it helps |
|---|---|---|
| Public, OCI location | An Oracle-managed location in an OCI data center. | Check a publicly reachable Fusion API from a selected OCI region. Availability Monitoring setup |
| Public, External location | An Oracle-managed location in an external data center. | See how the same public API responds from a location outside OCI. Oracle APM overview |
| Dedicated | A location set up inside your OCI tenancy and network. | Run checks through your chosen VCN path, including access to private endpoints when that network is configured to reach them. Dedicated vantage points |
| On-premise | An Availability Monitoring worker deployed on a VM in a network you operate. | Test a private endpoint from that network; use a non-browser worker for a Scripted REST check. On-premise vantage points, worker types |
This exercise uses selected public vantage points for a reachable Fusion pod. Choose additional locations based on the network path the integration uses; each location contributes its own execution result.
At each selected vantage point, the script builds the request, authenticates with the monitoring account, and checks the returned data. A failed assertion fails that execution. Comparing the same check across locations helps distinguish a widespread problem from one concentrated along a particular access path.
Create a script for an API check
Open Observability & Management → Application Performance Monitoring → Availability Monitoring → Scripts, select the compartment and APM domain, and choose Create Script. Upload a JavaScript .js file. After saving the script, create a Scripted REST monitor that references it. Oracle documents postman-request for HTTP calls and ORAP placeholders for parameters, including secret values. Create an APM script
This compact items example shows the pattern. Set BASE_URL to the HTTPS origin, BASIC_AUTH_B64 to Base64 of the UTF-8 string username:password with Value is secret enabled, and ITEM_QUERY to an organization-and-item-scoped query, such as OrganizationCode='DEMO_ORG' AND ItemNumber='DEMO_ITEM', using your own test values. Base64 is reversible encoding, so treat that authentication value as a credential. The query is supplied through qs so the request library URL-encodes it.
const request = require("postman-request");
const baseUrl = "<ORAP><ON>BASE_URL</ON><OV>SET_IN_APM</OV><OS>false</OS></ORAP>";
const basicAuth = "<ORAP><ON>BASIC_AUTH_B64</ON><OV>SET_IN_APM</OV><OS>true</OS></ORAP>";
const itemQuery = "<ORAP><ON>ITEM_QUERY</ON><OV>SET_IN_APM</OV><OS>true</OS></ORAP>";

if ([baseUrl, basicAuth, itemQuery].some(v => !v || /SET_IN_APM|<ORAP>/.test(v))) {
  throw new Error("CONFIG: set the script parameters");
}
if (!/^https:\/\/[a-z0-9.-]+$/i.test(baseUrl)) {
  throw new Error("CONFIG: BASE_URL must be an HTTPS origin without a trailing slash");
}

oraSynCustomMarker("item_lookup", "startTime");
request({
  method: "GET",
  url: baseUrl + "/fscmRestApi/resources/11.13.18.05/itemsV2",
  qs: { q: itemQuery, fields: "ItemNumber,ItemId", onlyData: true, limit: 1 },
  headers: {
    Authorization: "Basic " + basicAuth,
    Accept: "application/json",
    "REST-Framework-Version": "4"
  },
  strictSSL: true, followRedirect: false, followAllRedirects: false,
  timeout: 20000
}, (error, response, body) => {
  if (error) throw new Error("REQUEST: item_lookup");
  if (!response || response.statusCode !== 200) throw new Error("HTTP: item_lookup");
  let data;
  try { data = JSON.parse(body); }
  catch (_) { throw new Error("JSON: item_lookup"); }
  const item = data && Array.isArray(data.items) && data.items[0];
  if (!item || item.ItemNumber == null || item.ItemId == null) {
    throw new Error("ASSERT: item_lookup expected item fields");
  }
  oraSynCustomMarker("item_lookup", "endTime");
  console.log("PASS: item_lookup");
});
This is an illustrative single-request check, verified locally with mocked responses; it has not been executed as a hosted monitor. It checks status, JSON, and item-field presence. The fuller scripts add stricter input validation, response-size and pagination controls, and sanitized diagnostic detail.
The paired literal markers measure the successful item_lookup step, including response validation. Failed checks throw a short diagnostic without printing credentials or returned records. The example uses a direct ITEM_QUERY parameter for readability; the fuller monitors build their queries from the fixture supplied in FIXTURE_B64.
What data does APM collect?
APM publishes availability and monitor execution-time metrics, with dimensions that include the monitor and vantage point. These support comparisons across locations and over time. APM metric definitions
The scripts add context through named timing markers and sanitized output:
- Availability: whether the execution satisfied the configured checks. A failure can reflect connectivity, authentication, response validation, or a fixture that needs attention.
- Execution time: how long the complete monitor took, plus custom durations around named script steps. A GET step can include pagination and validation; the batch marker measures the complete batch check.
- Response evidence: whether the expected HTTP status, JSON structure, selected fields, and applicable identity checks passed. Success output includes bounded row and request counts.
- Failure context: the operation that failed and a diagnostic such as a missing parameter, an HTTP error, or a transport error. Credentials and response bodies are excluded from the script’s own logs.
These signals help direct investigation. A missing fixture value calls for a configuration check. An HTTP 401 calls for investigation of authentication and access. Slower results concentrated at one vantage point suggest comparing that location’s access path with the others before attributing the delay to Fusion.
Custom assertions may appear under APM’s Unknown Error category, so inspect the script error message as well. A completed timing marker may also be absent when the execution fails early.
Monitor the business contexts
For an integration, availability includes being able to authenticate, access the intended resource, and receive a usable response. A successful HTTP connection is one part of that contract. The script also needs to check the response against a defined expectation.
A fixture supplies that context: a known item and organization, an existing work center, or a work order selected for testing. The script uses those values to make a focused request and evaluate the result. Small page limits and a request timeout keep each execution bounded.
| Business capability | Illustrative request | What the check examines |
|---|---|---|
| Items | GET /itemsV2 |
An organization-and-item-scoped lookup returns records with the expected item fields. |
| Inventories | GET /subinventories |
An organization-scoped query returns inventory reference records with expected fields such as the subinventory name. |
| Work centers | GET /workCenters |
A query for a known active work center returns the intended center. |
| Work orders | GET /workOrders |
A query for an existing work order returns a nonempty response with the selected fields. |
| Read-only batch | POST to the REST API root | One batch request returns the expected item and work-order read results. |
These resource paths sit below /fscmRestApi/resources/11.13.18.05. They are representative checks, rather than complete request definitions; each needs an appropriate query and fixture for the target pod.
The assertions determine what a green result means. In this implementation, the GET checks generally validate HTTP status, JSON content, nonempty collections, and selected field presence; they do not all compare every returned value with the fixture. The batch check additionally verifies the requested record identities. Inventory quantities and completion of a business process are outside these checks.
Exercise POST with a read-only batch
POST is useful here because Oracle’s batch interface accepts an envelope containing multiple operations, including reads. Our example posts to /fscmRestApi/resources/11.13.18.05/ with the media type application/vnd.oracle.adf.batch+json. Both enclosed operations use get. Oracle batch actions
The abbreviated body below illustrates the idea. The paths contain explanatory placeholders; the actual script constructs and URL-encodes queries from private fixture values.
{
  "parts": [
    {
      "id": "item_lookup",
      "path": "/itemsV2?<scoped item query>",
      "operation": "get"
    },
    {
      "id": "work_order",
      "path": "/workOrders?<known work-order query>",
      "operation": "get"
    }
  ]
}
A Scripted REST monitor can send that batch request with JavaScript. The example below takes BASE_URL as the HTTPS origin, BASIC_AUTH_B64 as the secret Base64 value of username:password, and FIXTURE_B64 as a secret Base64-encoded JSON object containing organization_code, item_number, and work_order_id. Supply existing test records when setting the monitor parameters. The script fixes both batch operations to get and URL-encodes their scoped queries.
const request = require("postman-request");
const baseUrl = "<ORAP><ON>BASE_URL</ON><OV>SET_IN_APM</OV><OS>false</OS></ORAP>";
const basicAuth = "<ORAP><ON>BASIC_AUTH_B64</ON><OV>SET_IN_APM</OV><OS>true</OS></ORAP>";
const fixtureB64 = "<ORAP><ON>FIXTURE_B64</ON><OV>SET_IN_APM</OV><OS>true</OS></ORAP>";
const apiPath = "/fscmRestApi/resources/11.13.18.05";
const mediaType = "application/vnd.oracle.adf.batch+json";

if ([baseUrl, basicAuth, fixtureB64].some(v => !v || /SET_IN_APM|<ORAP>/.test(v)) ||
    !/^https:\/\/[a-z0-9.-]+$/i.test(baseUrl)) {
  throw new Error("CONFIG: set valid script parameters");
}
let fixture;
try { fixture = JSON.parse(Buffer.from(fixtureB64, "base64").toString("utf8")); }
catch (_) { throw new Error("CONFIG: FIXTURE_B64"); }
function safeText(value) {
  return typeof value === "string" && !!value.trim() && value.length <= 128 &&
    !/[\x00-\x1f\x7f]/.test(value);
}
if (!fixture || typeof fixture.organization_code !== "string" ||
    typeof fixture.item_number !== "string" ||
    !/^[1-9][0-9]{0,17}$/.test(String(fixture.work_order_id)) ||
    !safeText(fixture.organization_code) || !safeText(fixture.item_number)) {
  throw new Error("CONFIG: expected item, organization, and work order");
}
function quoted(value) { return "'" + value.replace(/'/g, "''") + "'"; }
function path(resource, query, fields) {
  return "/" + resource + "?q=" + encodeURIComponent(query) +
    "&fields=" + encodeURIComponent(fields) + "&limit=1&onlyData=true";
}
const parts = [
  { id: "item_lookup", operation: "get",
    path: path("itemsV2", "OrganizationCode=" + quoted(fixture.organization_code) +
      " AND ItemNumber=" + quoted(fixture.item_number), "ItemId,ItemNumber,OrganizationCode") },
  { id: "work_order", operation: "get",
    path: path("workOrders", "WorkOrderId=" + fixture.work_order_id,
      "WorkOrderId,WorkOrderNumber") }
];

oraSynCustomMarker("batch_readonly", "startTime");
request({
  method: "POST", url: baseUrl + apiPath + "/",
  body: JSON.stringify({ parts }),
  headers: { Authorization: "Basic " + basicAuth, Accept: mediaType,
    "Content-Type": mediaType, "REST-Framework-Version": "4" },
  strictSSL: true, followRedirect: false, followAllRedirects: false,
  timeout: 20000
}, (error, response, body) => {
  if (error) throw new Error("REQUEST: batch_readonly");
  if (!response || response.statusCode !== 200) throw new Error("HTTP: batch_readonly");
  const contentType = response.headers && response.headers["content-type"];
  if (typeof contentType !== "string" ||
      !/^application\/vnd\.oracle\.adf\.batch\+json(?:\s*;.*)?$/i.test(contentType)) {
    throw new Error("CONTENT_TYPE: batch_readonly");
  }
  if ((typeof body !== "string" && !Buffer.isBuffer(body)) ||
      Buffer.byteLength(body) > 2 * 1024 * 1024) {
    throw new Error("BODY: batch_readonly");
  }
  let result;
  try { result = JSON.parse(body.toString("utf8")); }
  catch (_) { throw new Error("JSON: batch_readonly"); }
  if (!result || !Array.isArray(result.parts) || result.parts.length !== 2) {
    throw new Error("BATCH: expected two parts");
  }
  const byId = Object.create(null);
  for (const part of result.parts) {
    if (!part || !["item_lookup", "work_order"].includes(part.id) ||
        byId[part.id] || part.operation !== "get" || !part.payload ||
        !Array.isArray(part.payload.items) || part.payload.items.length !== 1) {
      throw new Error("BATCH: missing or invalid read part");
    }
    byId[part.id] = part.payload.items[0];
  }
  const item = byId.item_lookup;
  const order = byId.work_order;
  if (!item || item.ItemId == null || item.ItemNumber !== fixture.item_number ||
      item.OrganizationCode !== fixture.organization_code || !order ||
      String(order.WorkOrderId) !== String(fixture.work_order_id) ||
      !order.WorkOrderNumber) {
    throw new Error("ASSERT: batch_readonly identities");
  }
  oraSynCustomMarker("batch_readonly", "endTime");
  console.log("PASS: batch_readonly parts=2");
});
This compact example was verified locally with mocked responses; this exact excerpt has not been run as a hosted monitor. The fuller batch script adds stricter input, returned-path, pagination, and response-size handling. The monitoring account and fixture remain private.
The monitor validates the outer response and both returned parts, including their identities. HTTP 200 alone is insufficient: a missing, duplicate, erroneous, or mismatched part fails the check. The implementation fixes the two read operations in code rather than accepting arbitrary batch actions through parameters.
This exercises POST transport, authentication, batch processing, and result validation without creating or updating business records. It provides a useful additional monitoring pattern alongside the individual GET checks. Testing a business write would require its own transaction assertions and repeatable data lifecycle.
Monitor Fusion API endpoints in APM
Start with an APM domain, a monitoring account that can access the selected Fusion records, and a vantage point that can reach the pod. Prepare one stable fixture and confirm the request locally before scheduling it.
1. Upload and configure the script
In Observability & Management → Application Performance Monitoring → Availability Monitoring, select the compartment and APM domain, open Scripts, and choose Create Script. On Script Definition, upload one .js file for the capability you want to check. For example, the items script contains its HTTP request and assertions; the read-only batch script contains its POST and two fixed GET parts. Confirm that the uploaded content is the intended version before continuing. Create an APM script
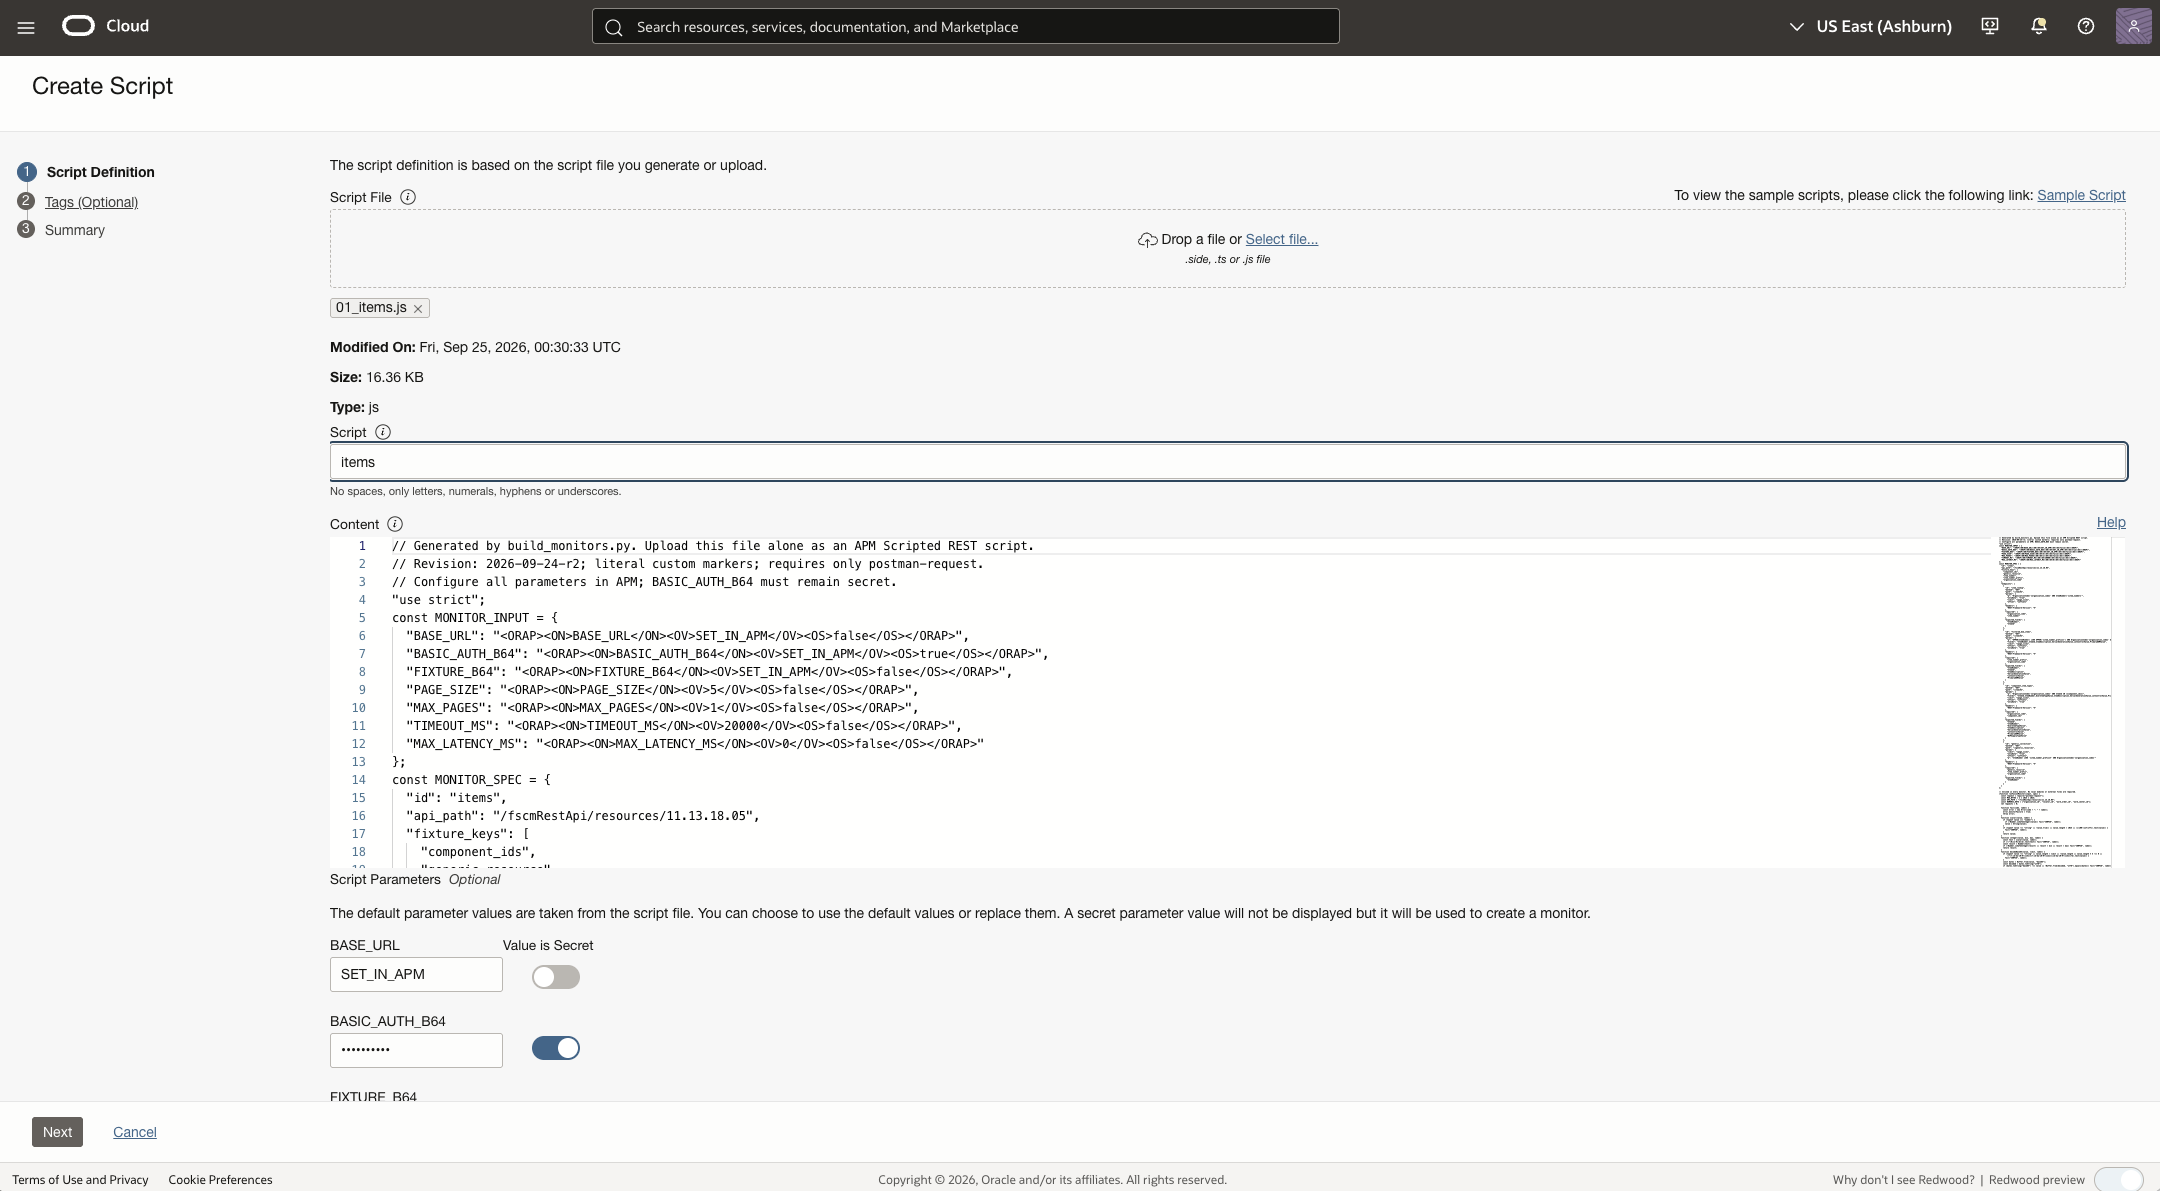
Figure 2. Uploading the full items Scripted REST file.
The script’s ORAP placeholders appear as Script Parameters below the content. Set BASE_URL to the Fusion HTTPS origin without a trailing slash. Set BASIC_AUTH_B64 to the Base64 value of username:password and turn on Value is secret. Set FIXTURE_B64 to Base64-encoded JSON containing the selected test identifiers and mark it secret when those identifiers are private. The earlier capture below has the fixture’s secret toggle off; enable it for private identifiers before saving. Base64 is reversible encoding, so neither value is safe to publish. Keep the script’s request-size, page-count, and timeout settings bounded.
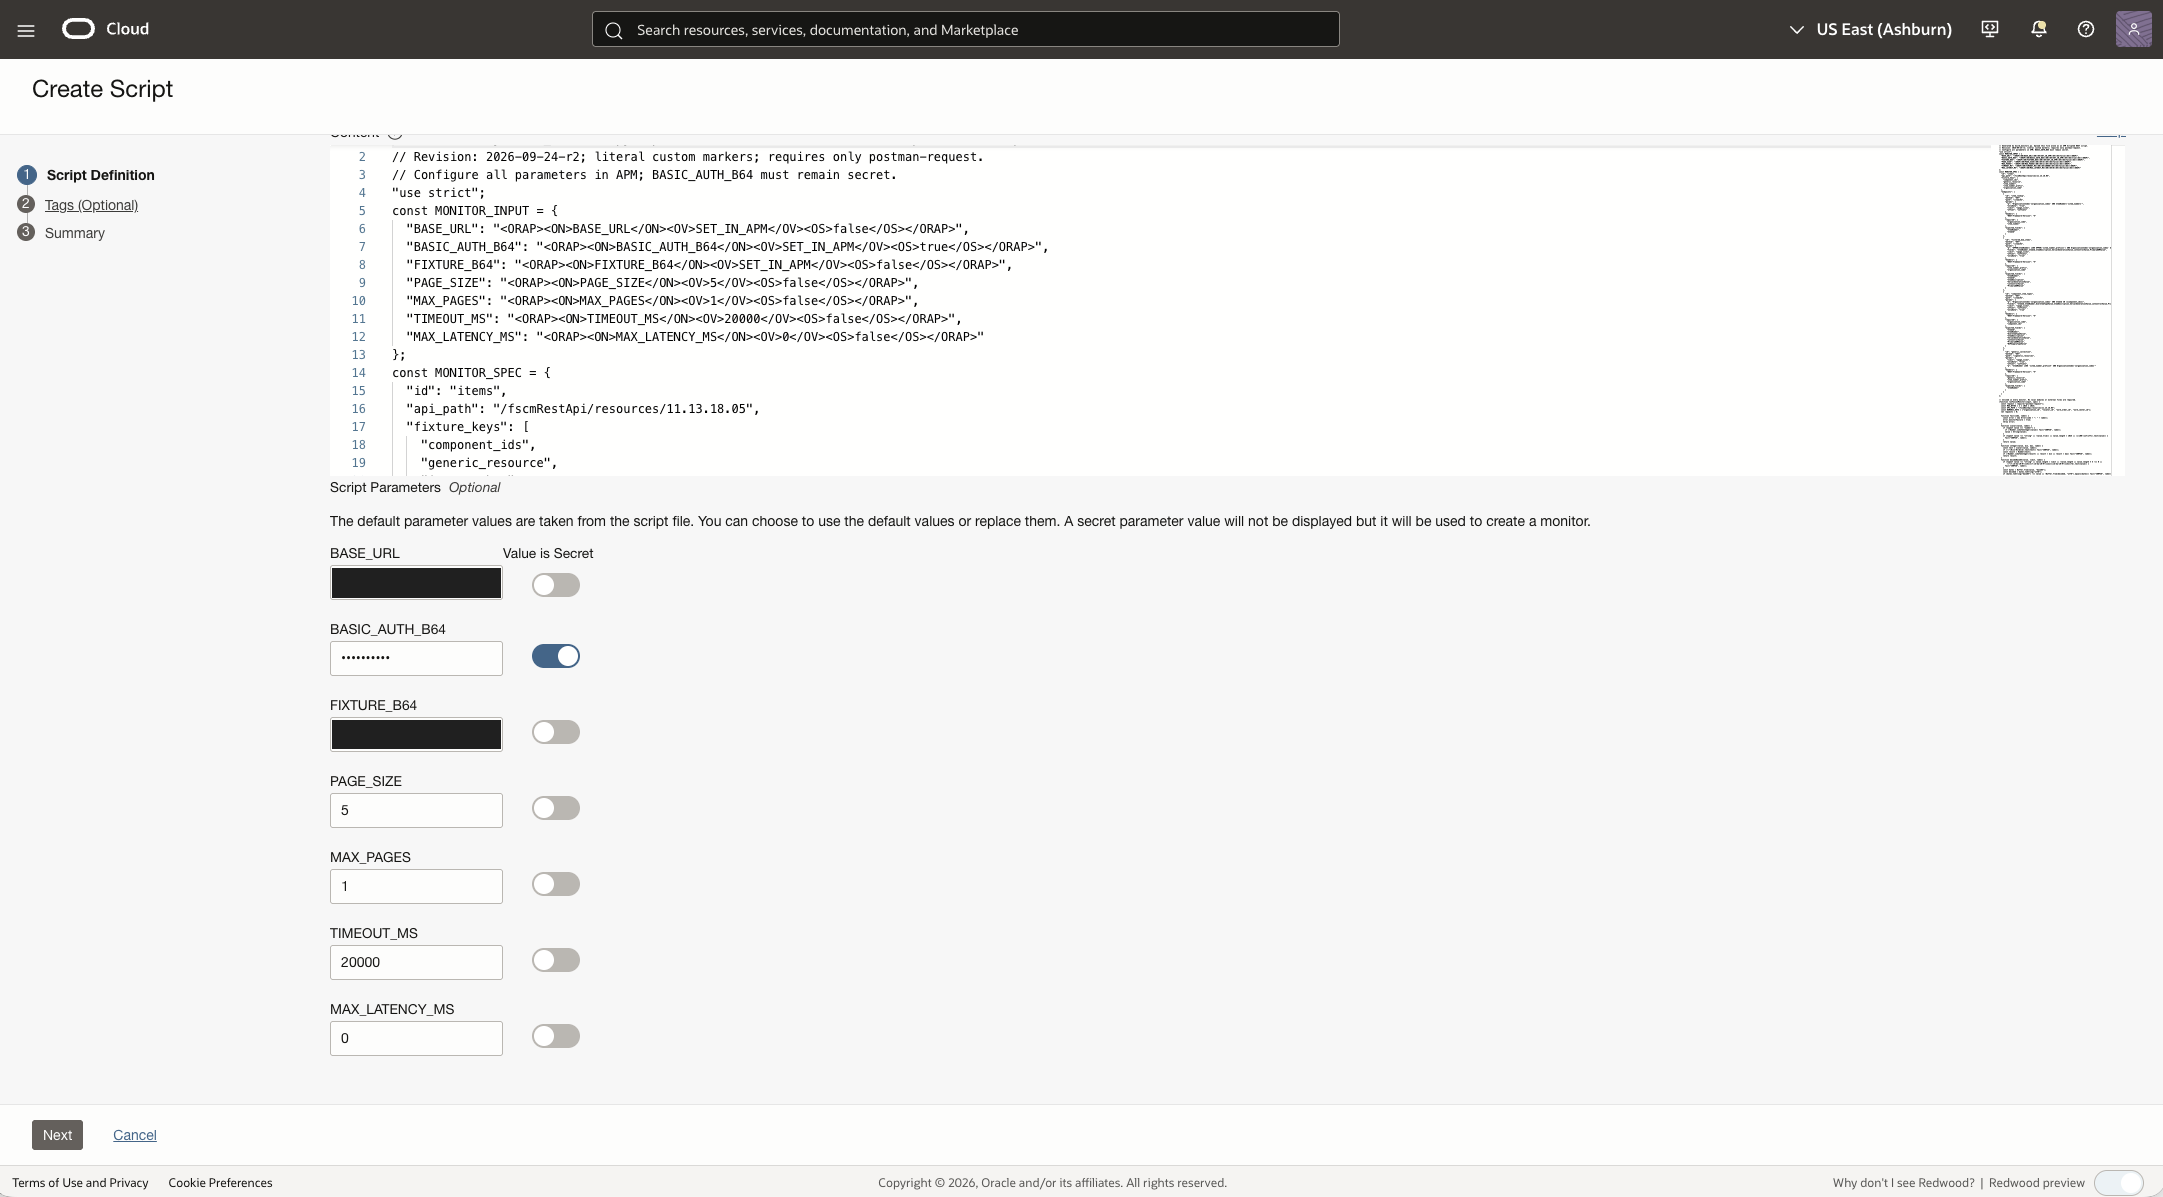
Figure 3. Configuring script parameters and secret values.
Choose Next, add tags if needed, and check the Summary page before selecting Create. Verify the script name and parameter names; a summary only confirms what will be saved, not that the API request has succeeded. The capture below shows the equivalent summary for the read-only batch script.
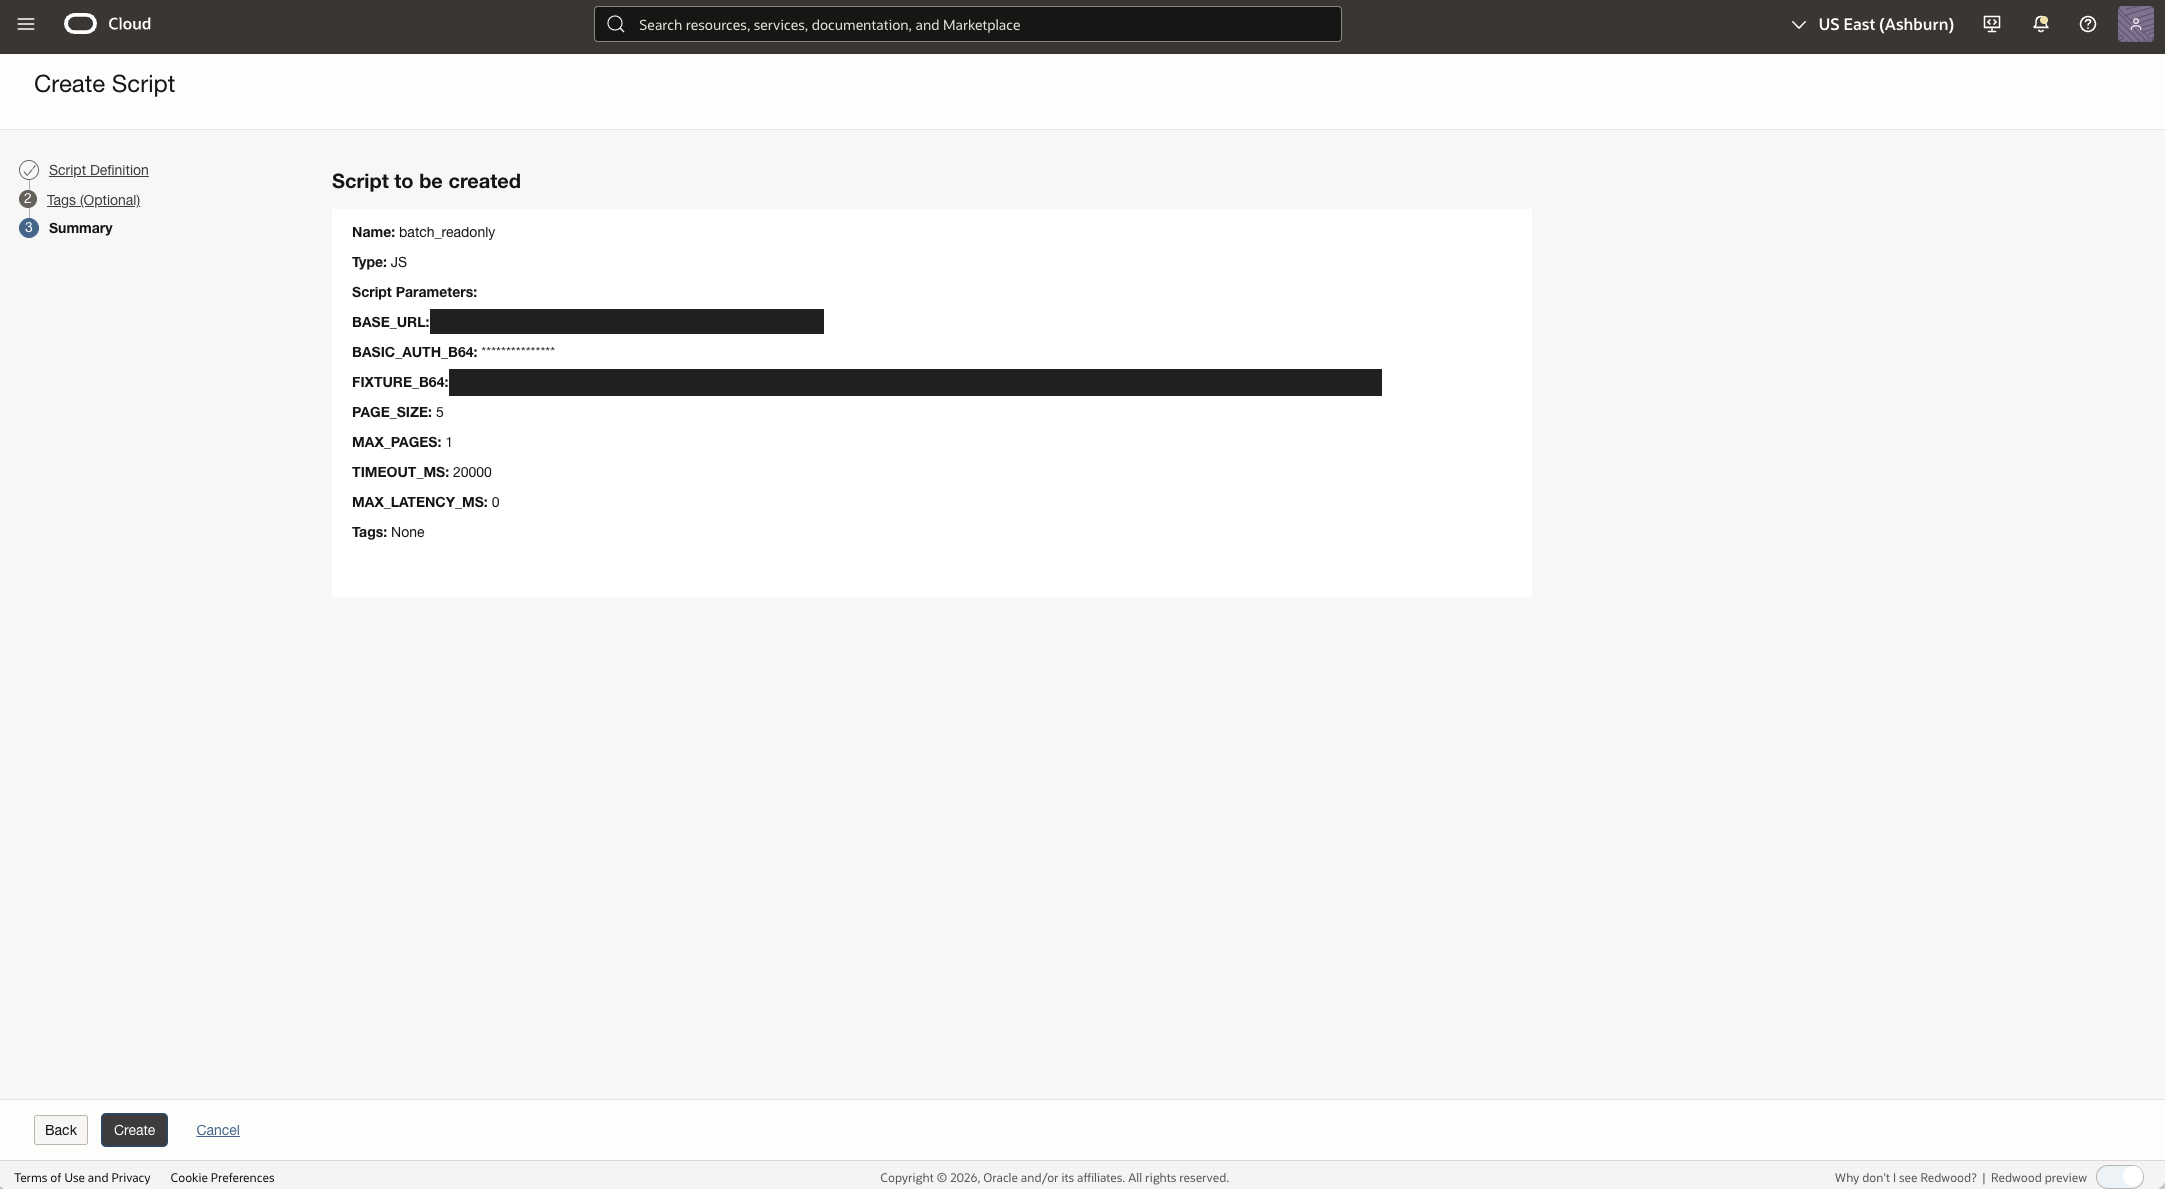
Figure 4. Reviewing the read-only batch script summary.
2. Create and configure the monitor
From the saved script’s page, choose Create Monitor, or open Monitors → Create Monitor in the same APM domain. Enter a distinctive name, select Scripted REST, and choose the saved .js script. The script parameters are available on Monitor Definition; verify their values for this environment and keep BASIC_AUTH_B64 secret.
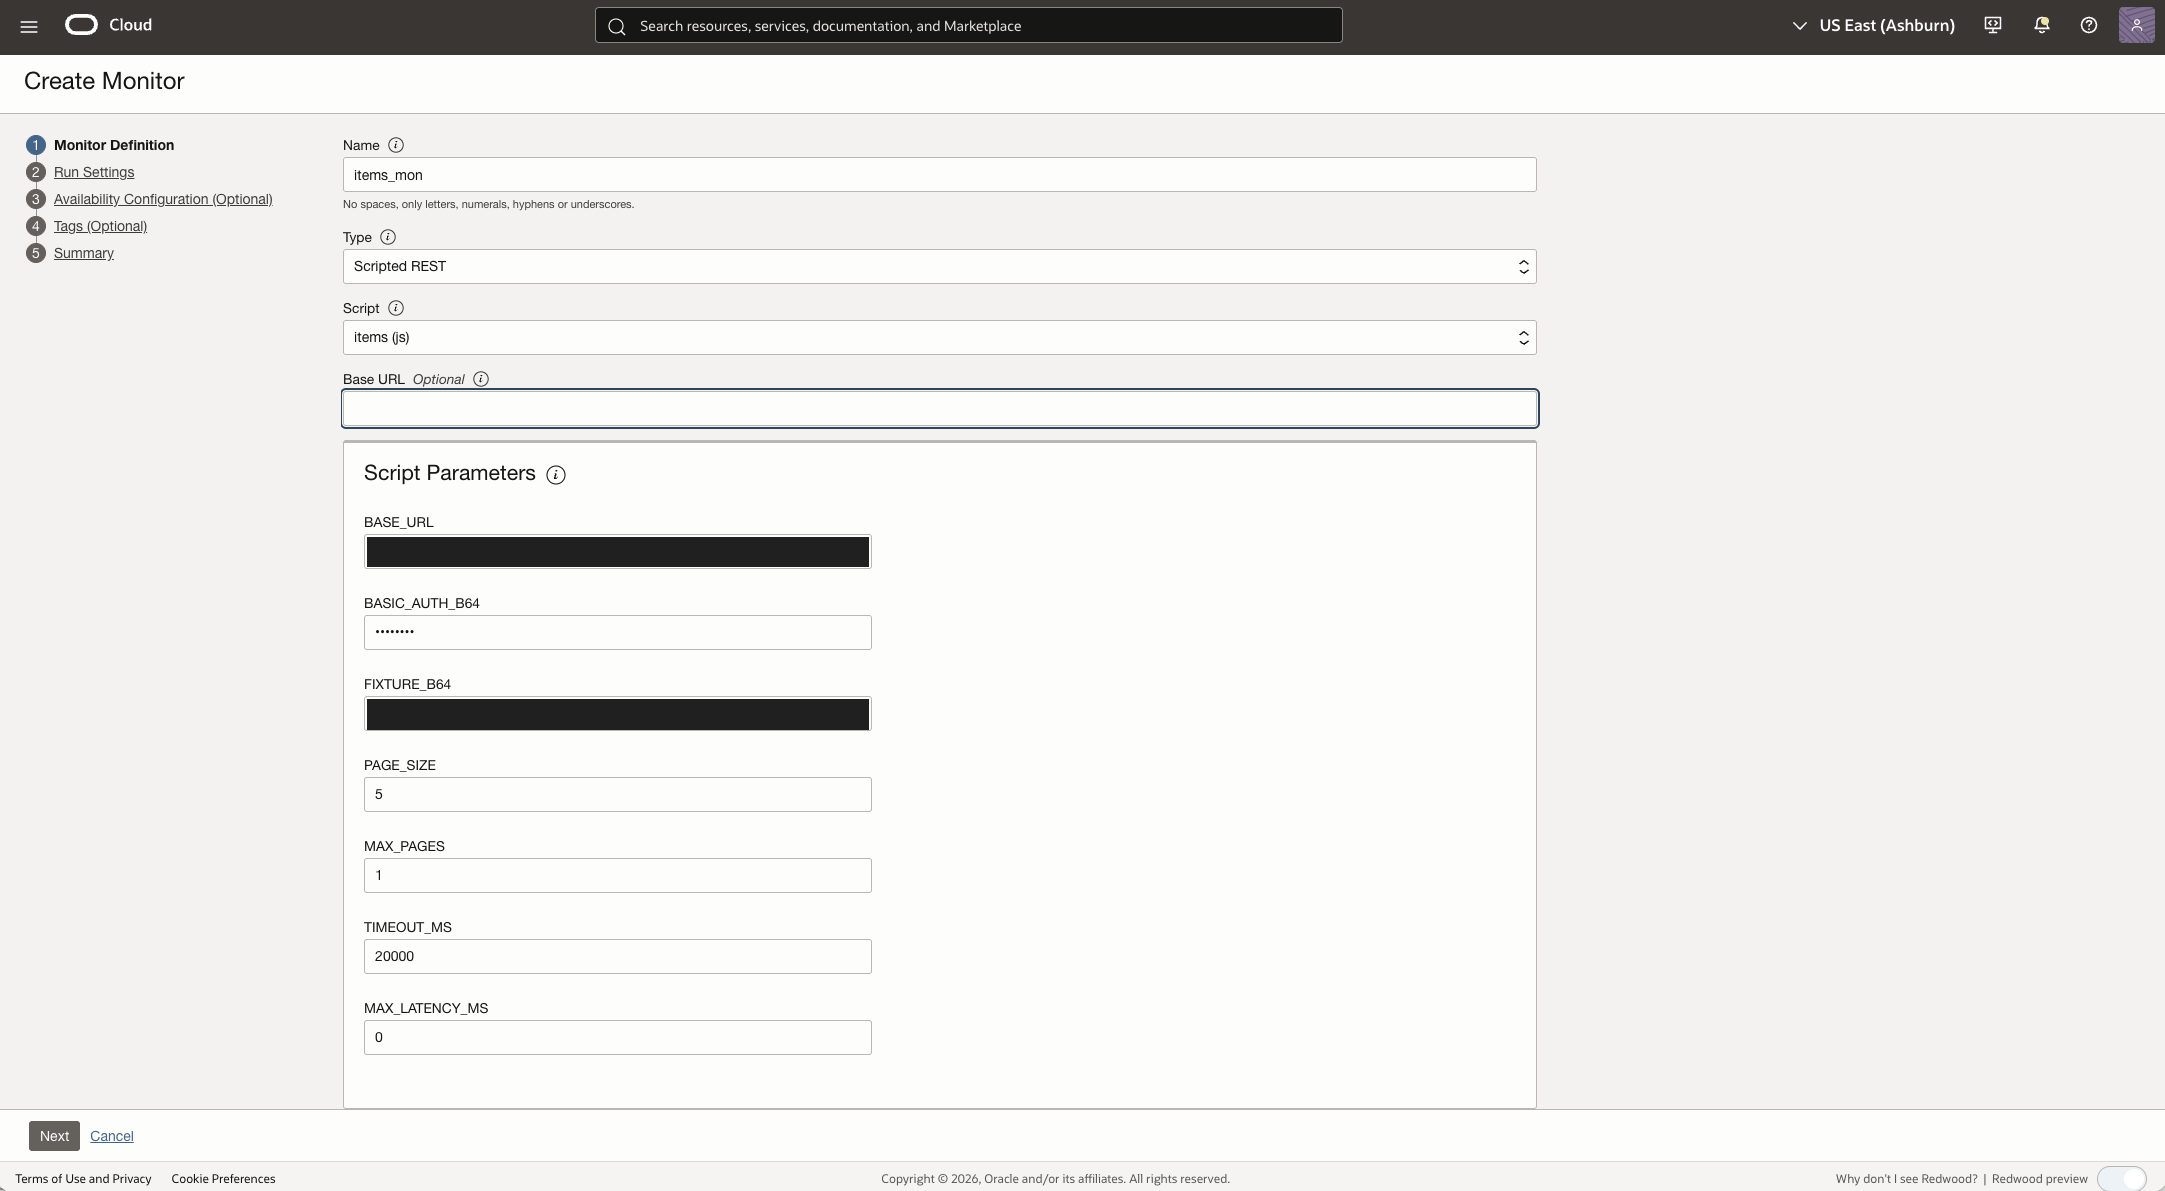
Figure 5. Historical monitor definition with an empty monitor-level Base URL.
Enter the Fusion HTTPS origin, without a trailing slash, in both places: the monitor-level Base URL field and the script parameter BASE_URL. The monitor form in this setup requires its own Base URL even though the script builds complete request URLs from its parameter. Oracle’s documentation labels the monitor-level field optional, so check the behavior of the APM form you use; the earlier empty-field capture above is no longer the configuration to follow here. Scroll down to Authentication and leave its type at None: this script supplies the Basic Authorization header itself. Under Response Validations, select response code 200; the JavaScript also checks the status and the returned data. Leave Override DNS off unless the network design specifically requires it. Oracle monitor configuration
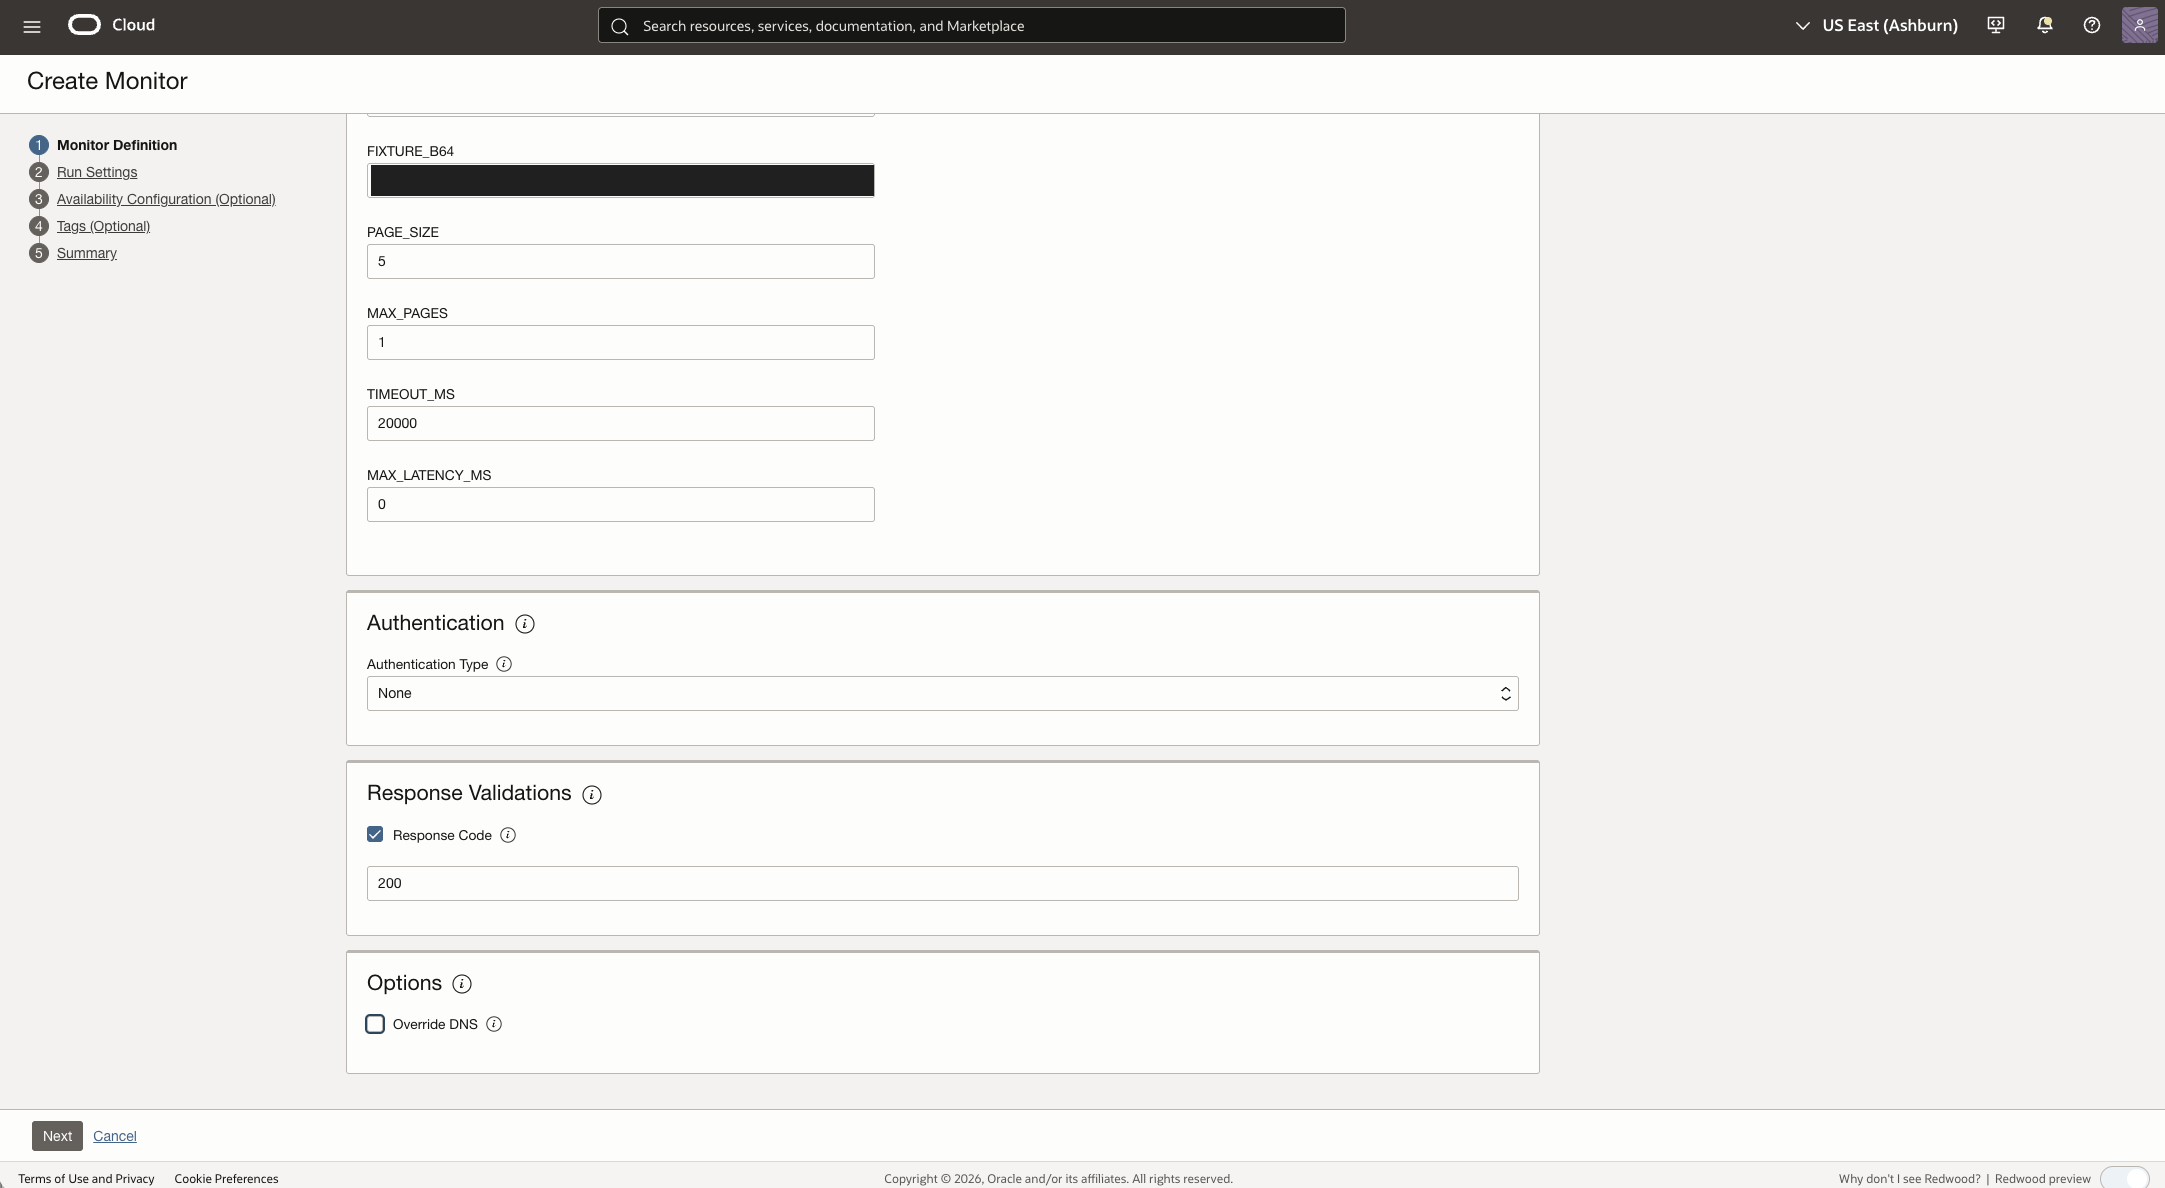
Figure 6. Configuring authentication, response validation, and DNS options.
3. Set the execution locations and cadence
On Run Settings, select the vantage points that represent the integration’s access path. For an initial diagnostic, choose one location and Run once; once that execution succeeds, expand to the intended locations and select Interval for continuous monitoring. Set the monitor timeout long enough for the script to finish; the captured setup used three minutes, while each request in the example has its own 20-second timeout. Disable Enable Retry for the first diagnostic so its result is easier to interpret, then decide whether retries fit the operational policy. Figure 7 captures a later choice of four public vantage points, Run once, and retry enabled.
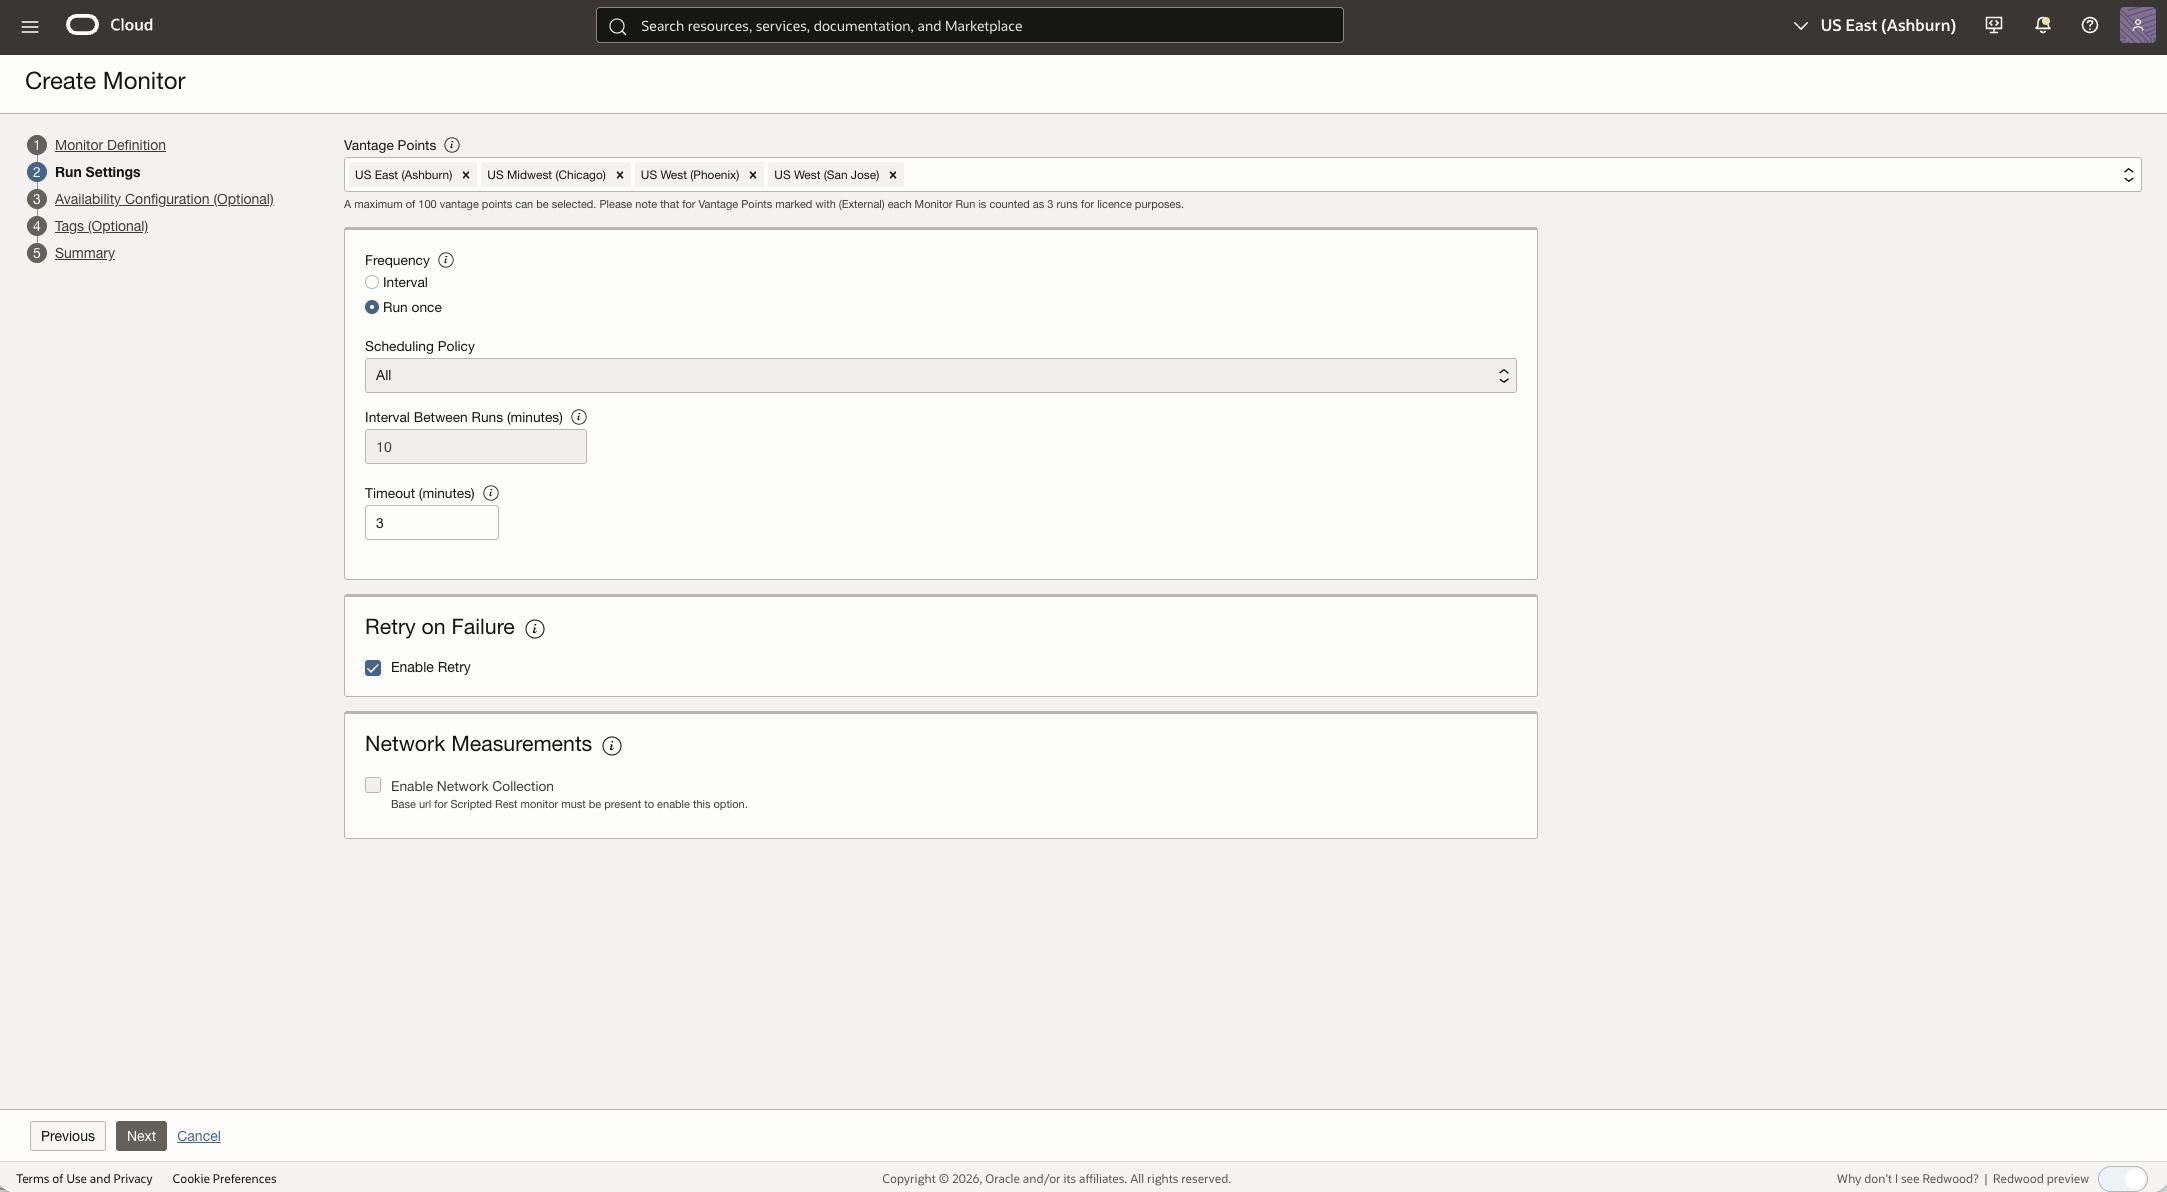
Figure 7. Selecting vantage points and run settings.
For the current setup, leave Enable Network Collection unchecked even though both Base URL fields are populated. The image above shows the same unchecked option in the earlier configuration with an empty monitor-level Base URL. Network Collection is a separate measurement option; leaving it unchecked here does not imply a general incompatibility with Fusion. Oracle documents that the option is shown for Scripted REST when a monitor-level Base URL is specified. Run settings and Network Collection
4. Define availability and review the summary
On Availability Configuration (Optional), enable the calculation if you want the dashboard’s availability widget to classify each interval. The captured example allows 0 maximum failures and requires 1 minimum run per interval. With those thresholds, any failed run makes an interval with enough runs unavailable; too few runs makes it unknown and excludes it from the availability calculation. Choose thresholds appropriate for the final schedule and number of vantage points. Availability configuration
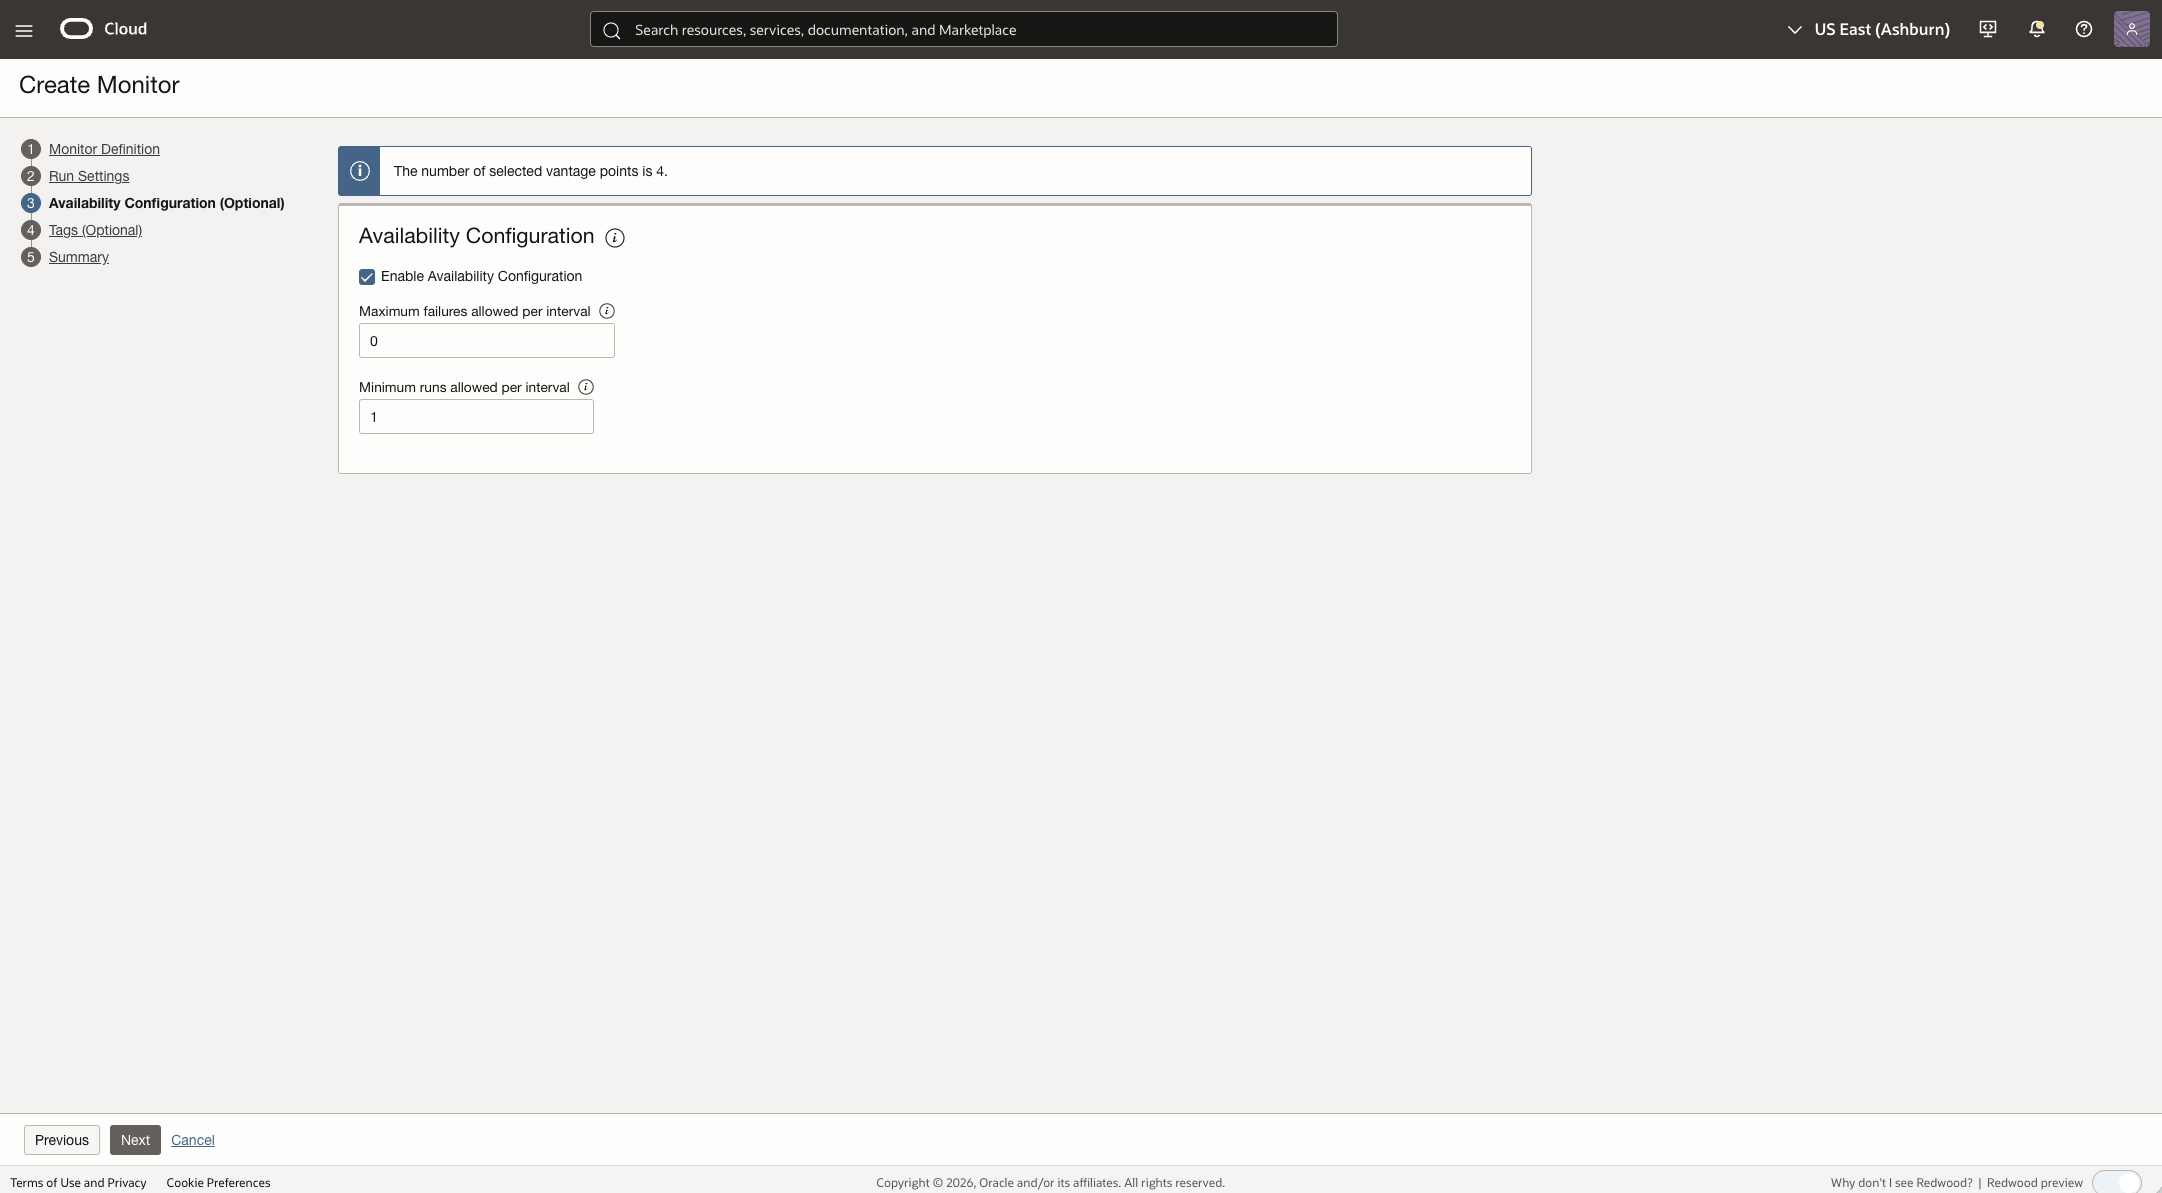
Figure 8. Setting availability thresholds for monitor runs.
Choose Next, add optional tags, and inspect Summary. Confirm that the monitor-level Base URL and the script parameter BASE_URL both show the intended Fusion origin. Also review the script name, authentication type, response validation, vantage points, cadence, retry, Network Collection, and availability thresholds before clicking Create. The summary screenshot is a historical configuration review, not proof of a completed run or an example of the new Base URL setting.
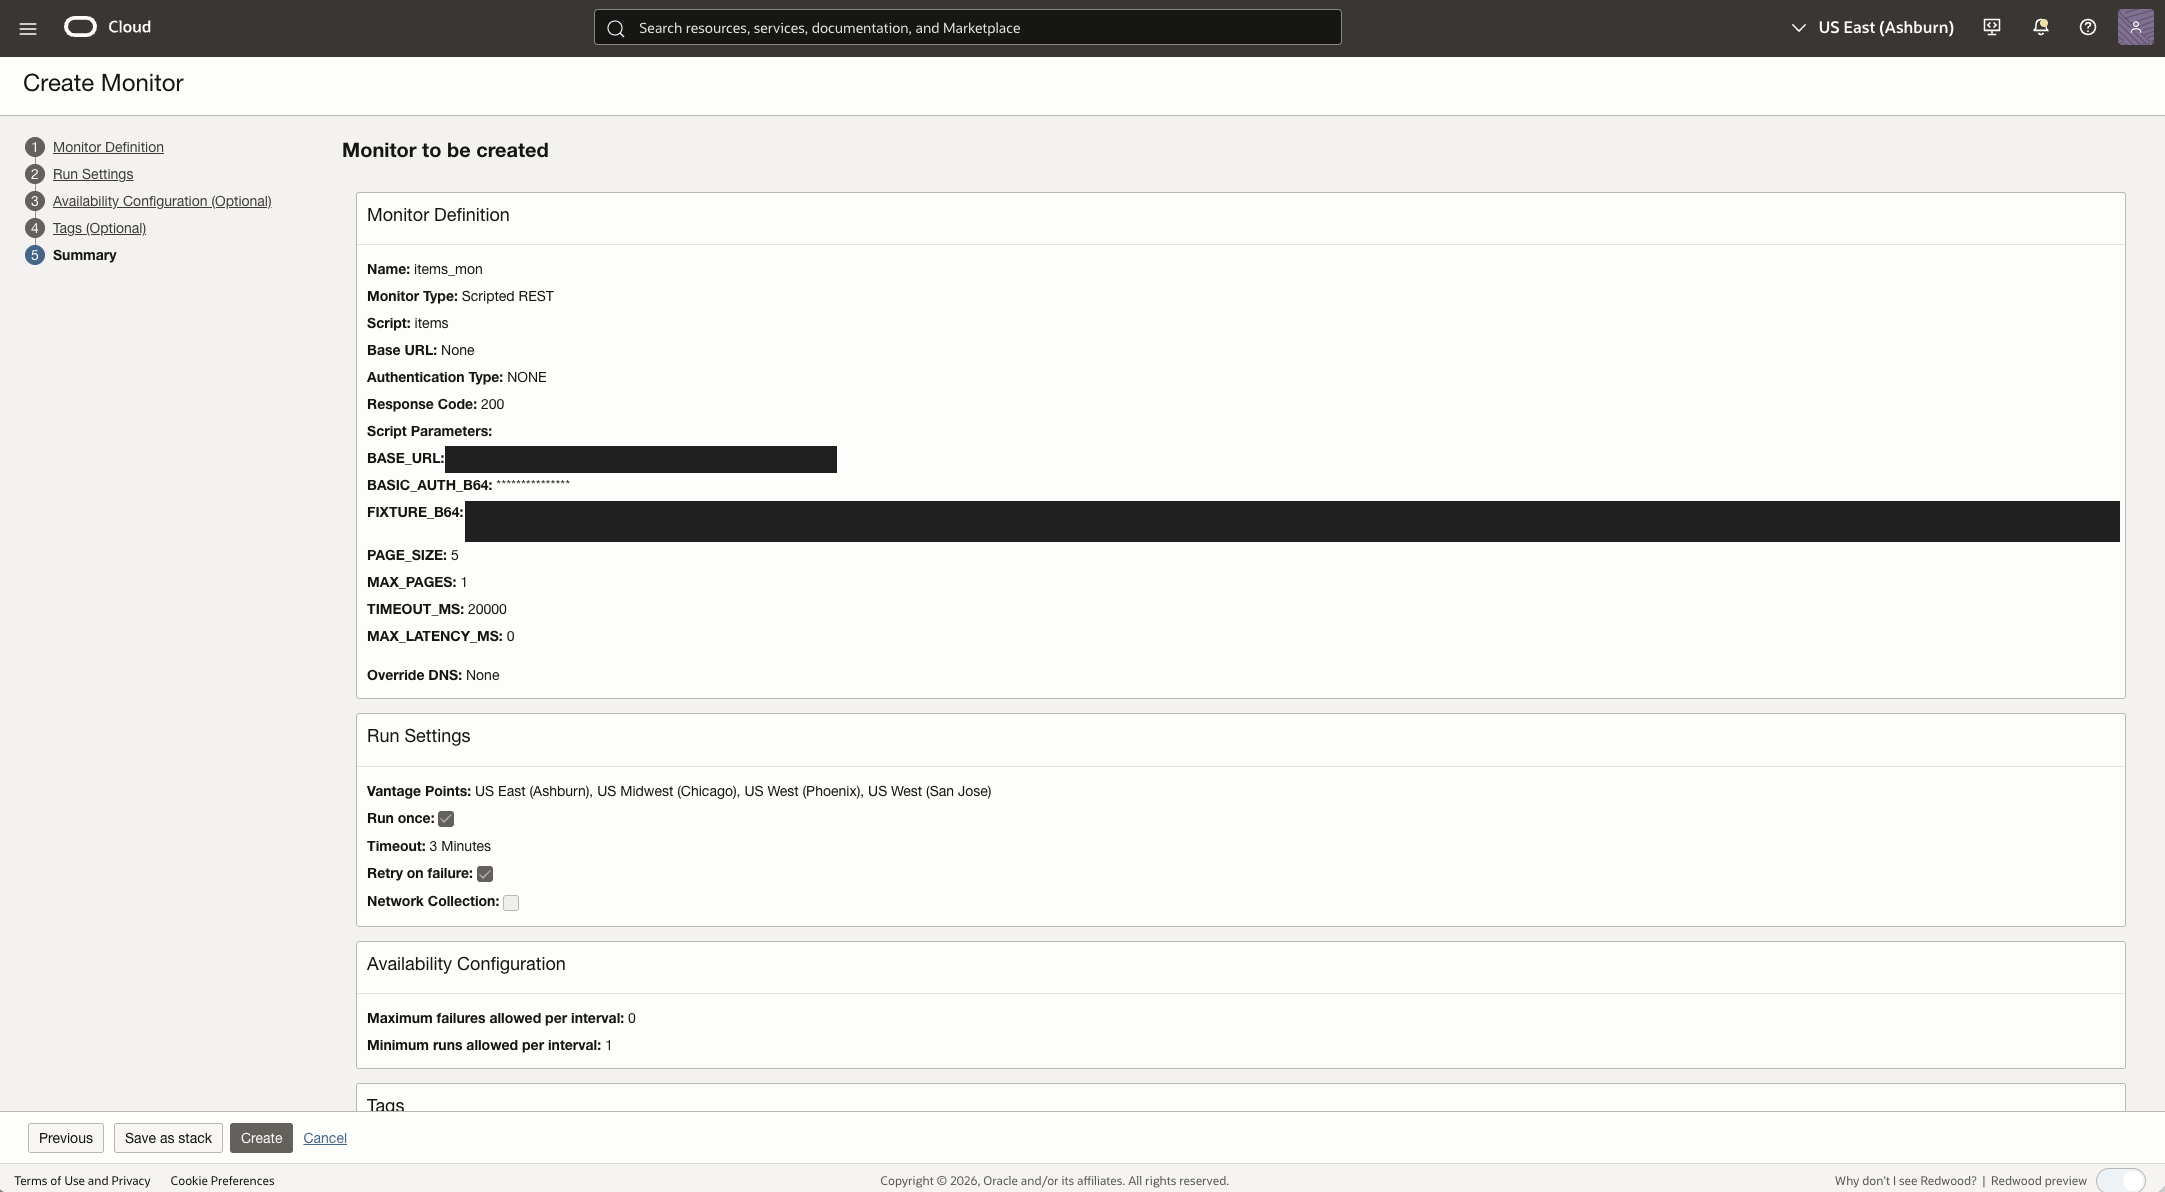
Figure 9. Reviewing the historical monitor summary before creation.
Inspect the newest execution in History before choosing a recurring interval. Verify the timestamp, vantage point, assertions, and duration. Then add the other selected capabilities, each with its own fixture, and expand the locations according to the integration’s access requirements.
Development evidence included a successful hosted items check and local validation of the other selected GET patterns. The exact read-only batch script passed locally against Fusion. The later dashboard screenshots also show recorded successes and failures for the hosted batch monitor. Those aggregate counters do not identify the executed script revision or establish which response assertions passed; use individual run output to confirm that baseline.
Create monitoring widgets using APM monitor KPIs
Each Availability Monitoring execution produces signals that can answer three operational questions: Is the Fusion endpoint available? How long does the scripted check take? Are failures recurring or concentrated at one vantage point? Build widgets around those questions so the dashboard shows the health of the business API checks, not merely a collection of charts. The supplied test dashboard includes historical series beyond the five examples in this article; its successes and failures are not a production SLA.
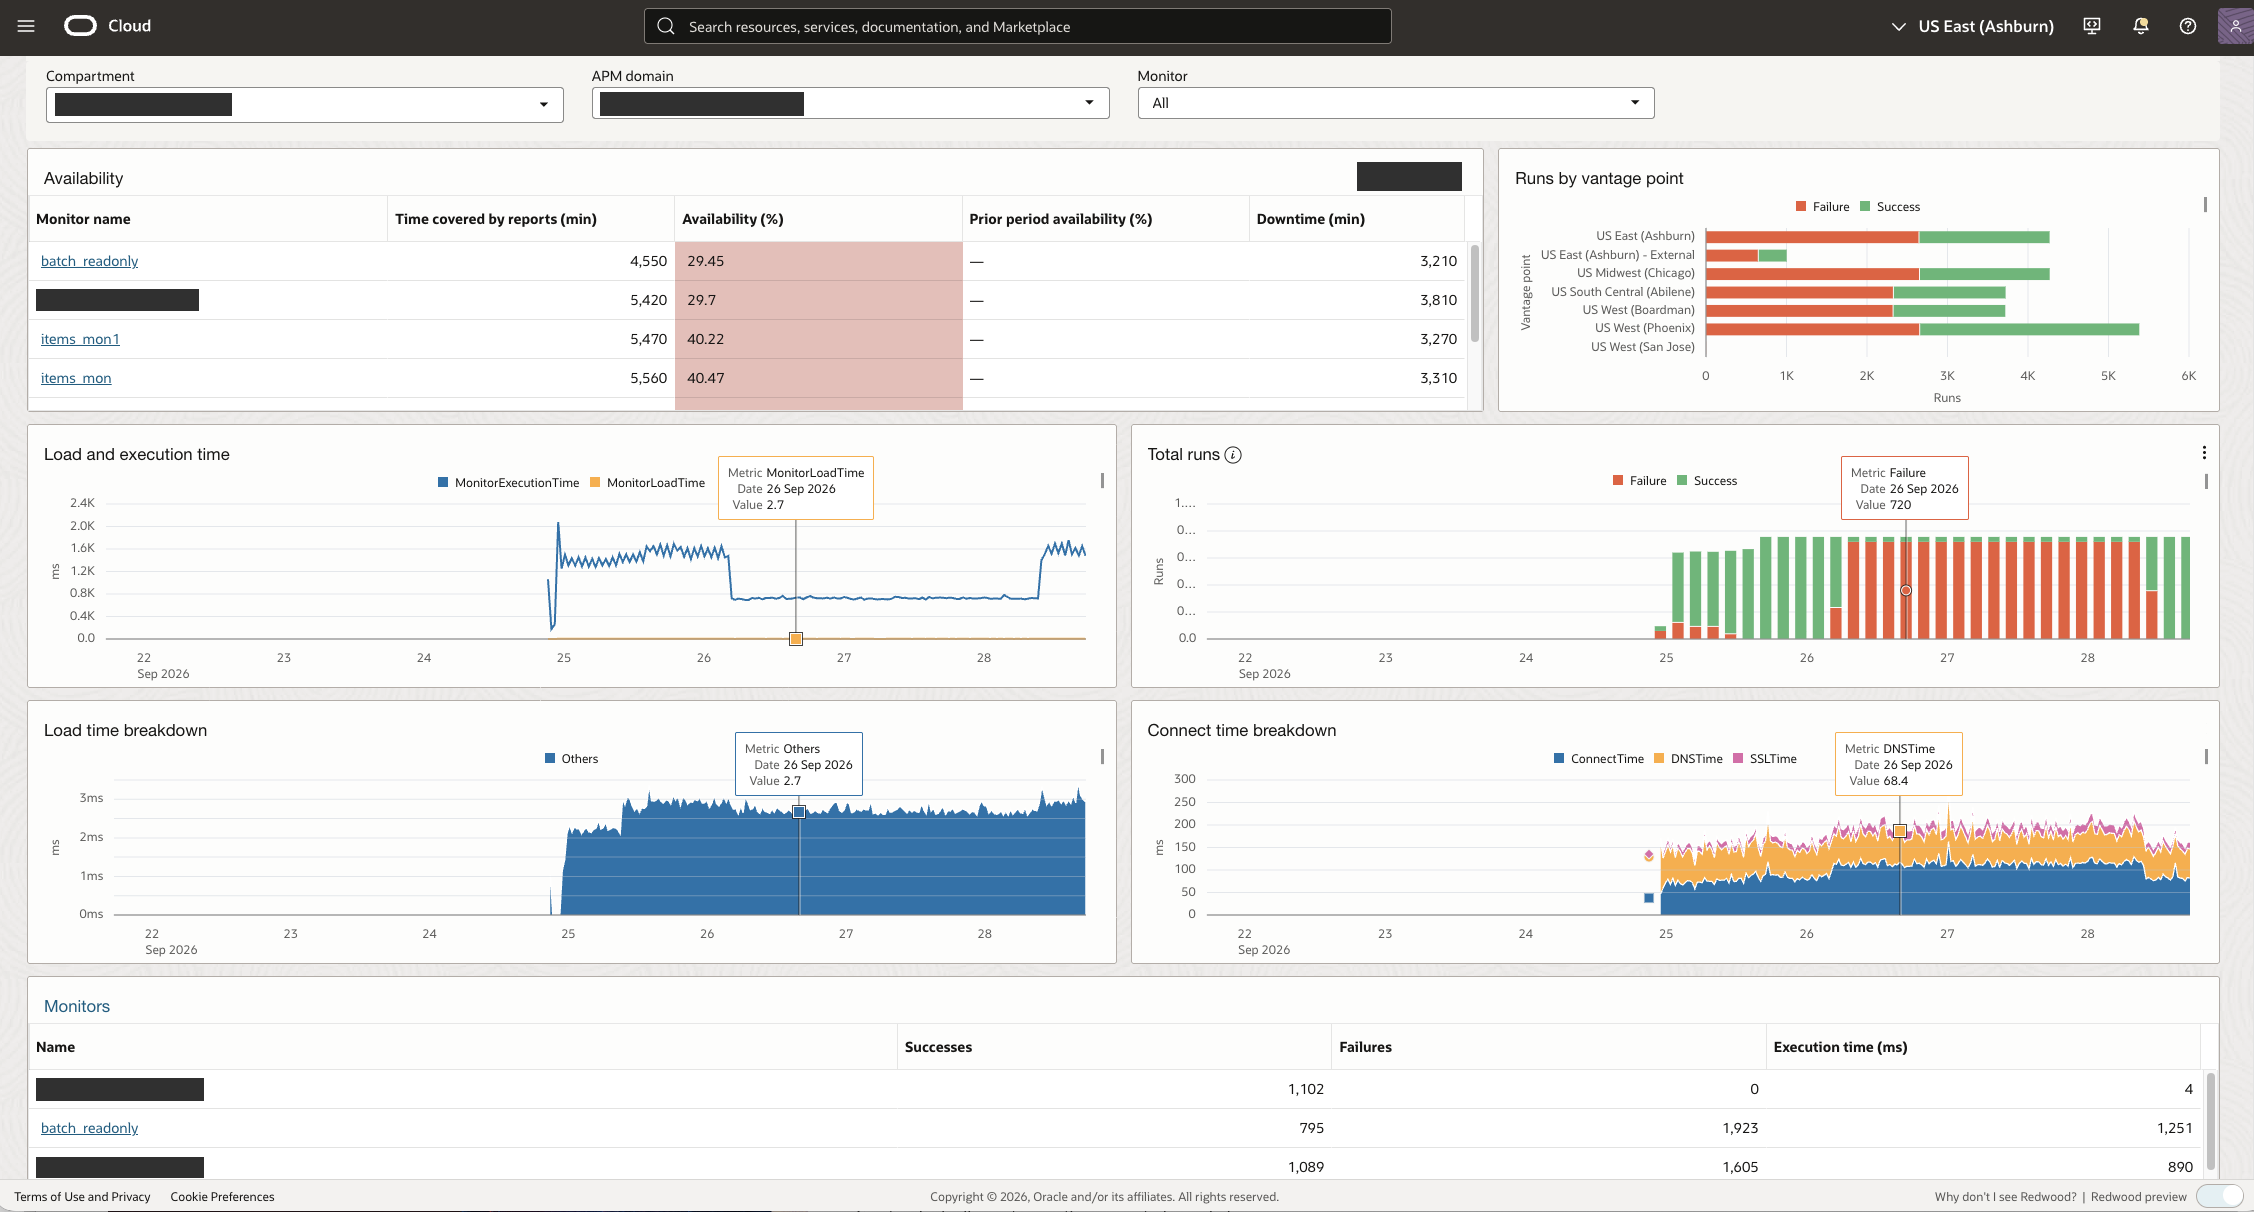
Figure 10. Viewing availability and run results in the APM dashboard.
Start with a small KPI set, then choose a widget that makes each signal easy to interpret. The metrics below come from the oracle_apm_synthetics namespace. They measure synthetic monitor runs and requests, not the volume or end-to-end success of the customer’s integration traffic. APM metric definitions
| Monitoring question | Metric | Suggested widget and interpretation |
|---|---|---|
| Availability: Are the selected API checks passing? | Availability |
Show a trend or current value by MonitorName; 1 means a successful run and 0 a failed run. Mean × 100 gives the success percentage for the selected runs and period. |
| Performance: Is the complete check getting slower? | MonitorExecutionTime |
Plot a line by monitor and, when useful, vantage point. The metric measures the whole monitor execution in milliseconds. |
| Performance detail: Which scripted step changed? | CustomMetric |
Plot a named CustomMarker, such as item_lookup or batch_readonly, beside overall execution time. A marker may be absent when a run fails before its end marker. |
| Reliability: How often do runs fail? | Failure |
Sum failures per time bucket and compare them with successful runs or the availability trend. Failure is 1 for a failed run, 0 otherwise. |
| Failure diagnosis: Did requests return HTTP errors or no response? | HTTP4xxFailureCount, HTTP5xxFailureCount, TotalRequestFailures |
Use separate count charts so an HTTP response error is not confused with a request that received no response. |
| Synthetic activity: Were checks actually sent? | RequestCount |
Show the count of requests generated by these monitors; this is not business integration traffic. |
For count metrics, sum within a time bucket. For execution times, start with a mean and keep the native millisecond unit clear; compare failure counts before treating a sudden shorter run as an improvement. Choose a bucket that fits the monitor’s schedule. APM metric names, units, and dimensions
Create the widgets. A Metric line chart is one way to show execution time or availability over time; use a table or count chart when it communicates outcomes more clearly. The following steps use the APM dashboard editor:
- Open Observability & Management → Application Performance Monitoring → Dashboards. Create a dashboard or open a custom dashboard and choose Actions → Edit. To customize an Oracle-defined dashboard, duplicate it first. APM dashboard customization
- On the Widgets tab, choose a visualization for one KPI. For example, search for Metric line chart and add it to the canvas for execution time.
- Open Edit widgets, select that widget, and use the pencil icons beside Configured widget inputs. Set Namespace to
oracle_apm_syntheticsand Metric name toMonitorExecutionTime; verify that the data compartment contains the intended APM domain. - Label it Fusion monitor execution time, select a time range, and choose Save changes. Add separate widgets for availability and failure counts using the metrics in the table. Confirm that each series represents the intended monitor and location. Widget input configuration
An APM domain filter elsewhere on a dashboard does not automatically scope every generic metric widget. Check its input links. When you need explicit domain filtering and separate vantage-point series that the widget’s exposed inputs do not provide, use Widgets → + → Create query-based widget…, select Monitoring as the data source and oracle_apm_synthetics as the namespace, then enter a query such as:
MonitorExecutionTime[10m]{ResourceId="<APM_DOMAIN_OCID>",MonitorName="fusion_items"}.groupBy(MonitorName,VantagePoint).mean()
Replace the placeholders with your domain and monitor. This illustrative query uses a ten-minute aggregation interval and a mean for each monitor/location pair; the dashboard time range is a separate choice. Click Run, select a Line chart visualization, save the widget, and save the dashboard. Query-based metric widgets, Monitoring query syntax
Use MonitorName for a capability overview and VantagePoint to compare locations. ResourceId identifies the APM domain; MonitorId identifies an individual monitor. Prefer monitor names in public chart legends because Target can expose pod URLs. In Figure 11, MonitorExecutionTime measures the complete monitor run; the separate Latency metric measures network packet round-trip time, not the duration of a Fusion API operation. APM metric dimensions
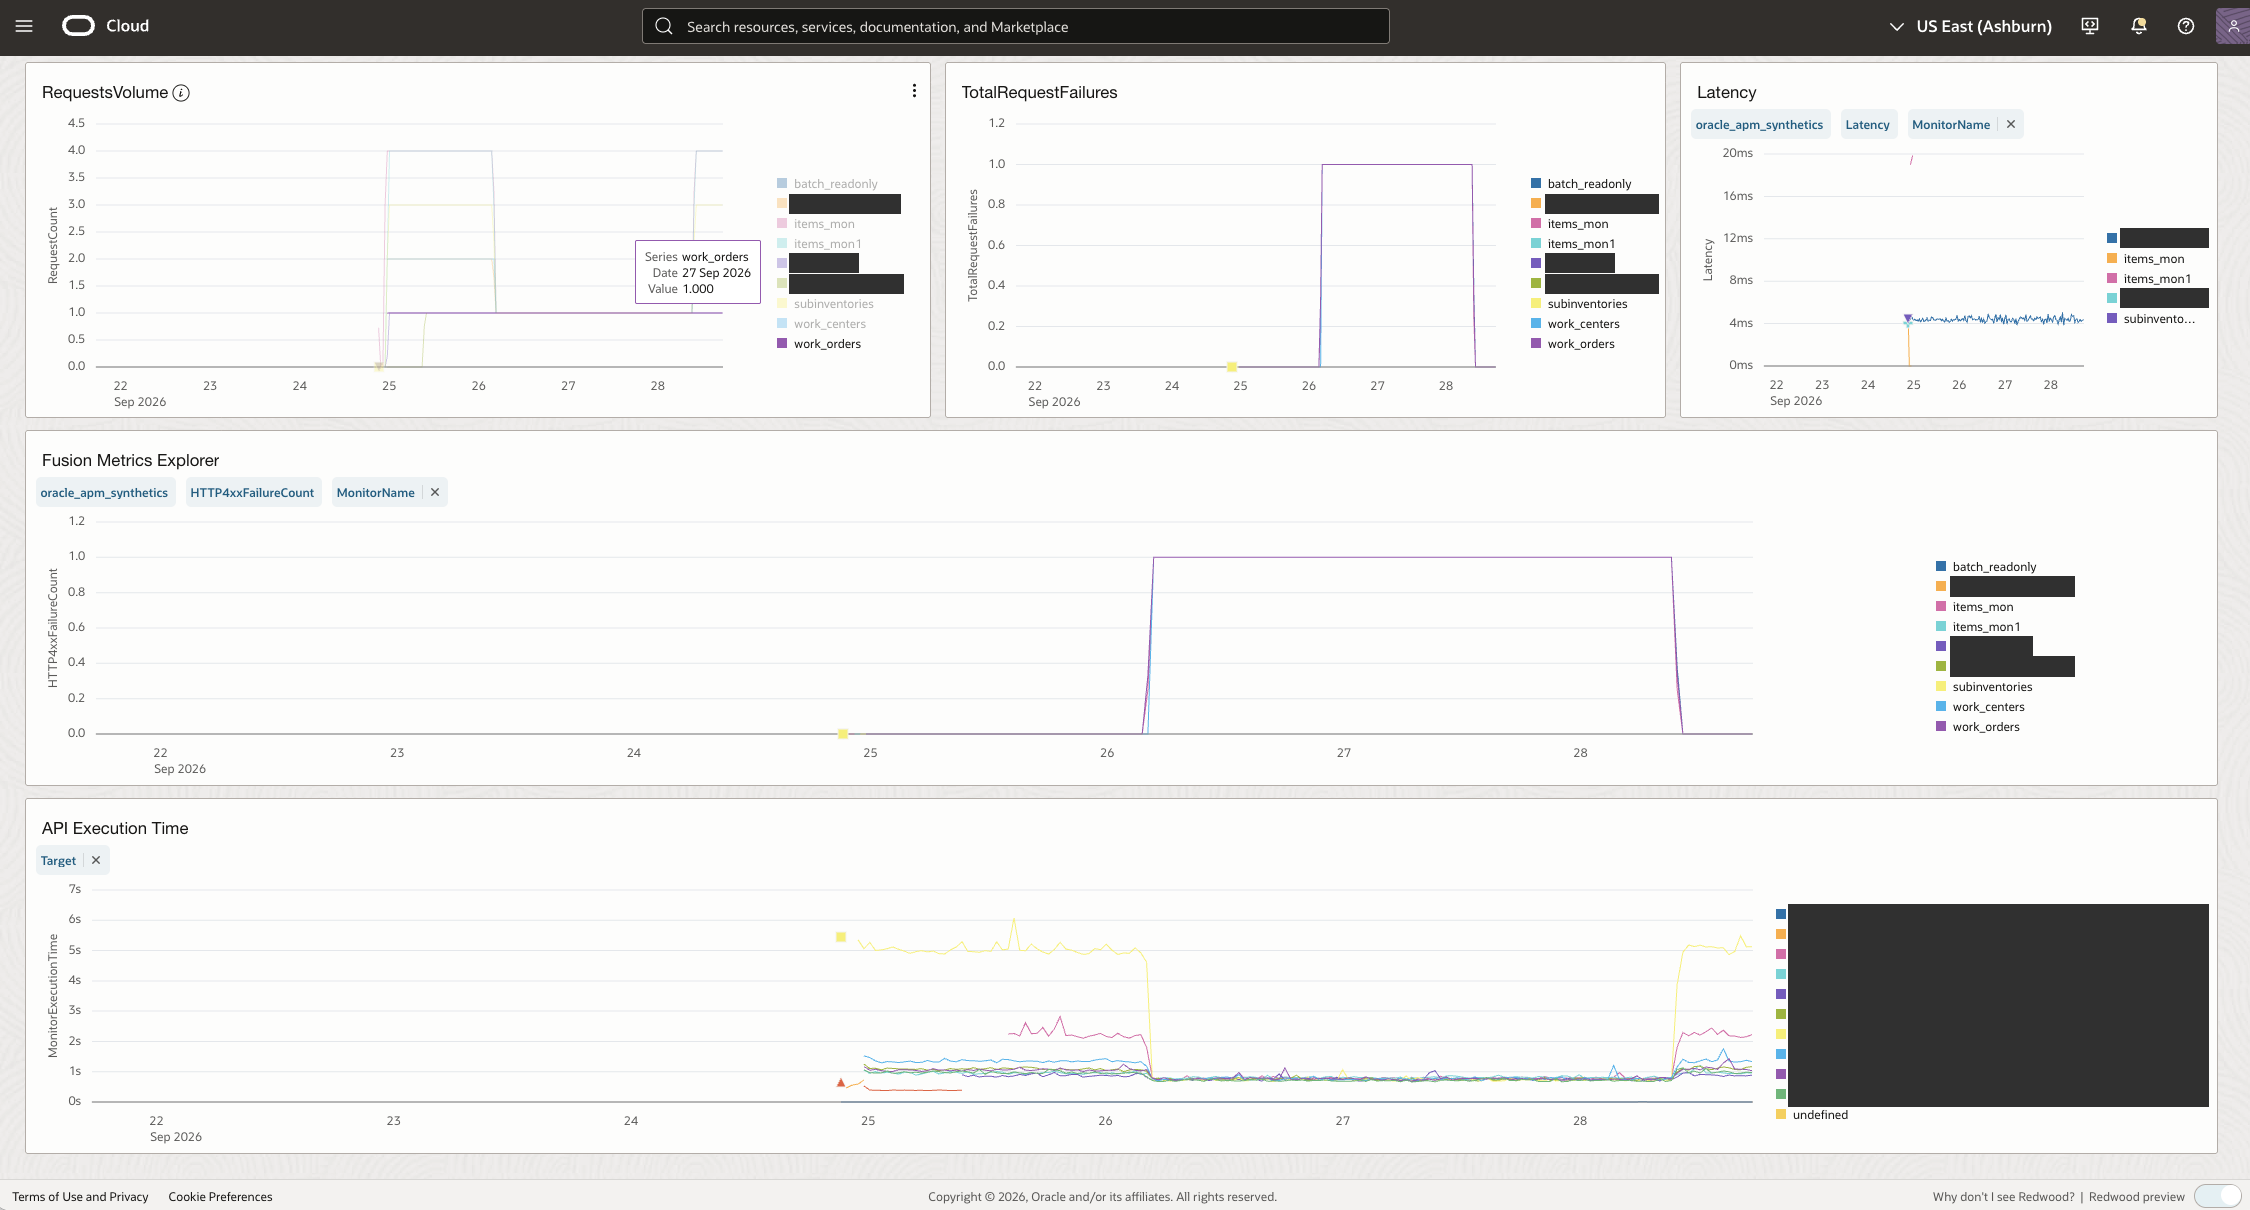
Figure 11. Charting synthetic requests, failures, and monitor execution time.
Use RequestCount to understand synthetic request activity, not the customer’s integration traffic volume. A shorter execution time can also accompany a request that fails early, so compare timings with success and failure signals. Gaps are missing observations, not evidence of zero latency or perfect availability. Select the same monitor and time window in History to investigate a change. APM synthetic metric definitions
Conclusion: make Fusion API health visible
This customer-inspired pattern turns an integration requirement into a repeatable check at the Fusion SaaS API boundary. A Scripted REST monitor asks a specific business question—can this account retrieve the expected item, inventory reference, work center, or work order?—from a chosen vantage point. A read-only batch adds coverage of POST transport without changing business records. The resulting availability, execution-time, and failure signals remain useful even when customer integration traffic is quiet.
The broader value for Fusion customers is a shared view of which capability is affected, when it changed, and from where the failure was observed. A dashboard can reveal a trend; the individual monitor run provides the request and assertion context needed to investigate it. As a Performance-pillar signal, this outside-in view complements real user experience monitoring, ESS process logs, integration logs, and security/audit analysis. A passing synthetic read does not prove that every business transaction or customer integration succeeded.
The five examples are a starting template, not a prescribed customer workload. Start with a few critical endpoints and stable, owned test records. Assign an owner to each fixture and monitor, validate the script from the intended vantage points, then schedule and review the checks as the integration evolves. That makes API availability an operational signal tied to business capabilities rather than an isolated pod status.
References
- Oracle APM overview: public locations in OCI and external data centers
- Set Up Availability Monitoring: public and private vantage-point options
- Use Dedicated Vantage Points
- Use On-premise Vantage Points
- Download a Worker: monitor types supported by each on-premise worker
- APM Availability Monitoring metrics and dimensions
- Create a query-based widget using metrics
Related Fusion observability posts by Royce Fu and coauthors:
- Real User Monitoring for Oracle Fusion SaaS Cloud Apps using OCI APM Browser Agent — browser-side user experience and performance.
- Fusion Apps Observability by Collecting Enterprise Scheduler ESS Logs Using OCI Logging Analytics REST API Ingestion — scheduled-process logs and operational visibility.
- Gaining Insights from Fusion ESS, Audit and Security Dashboards with AI Augmentation Using LoganAI – Part 3 — ESS, audit, and security analysis.