OCI Log Analytics for Oracle Database@AWS Fleet Log Management
Oracle Exadata Database Service delivers proven Oracle Database capabilities on purpose-built, optimized Oracle Exadata infrastructure in the public cloud and on Cloud@Customer. Built-in cloud automation, elastic resource scaling, security, and fast performance for all Oracle Database workloads help you simplify management and reduce costs. It is a crucial component for enterprises seeking to optimize their database performance and efficiency. Exadata Database Service
Given the complexity of managing an Exadata system, observability and monitoring are essential to achieving operational readiness. Comprehensive observability enables administrators to gain deep insights into system performance, detect anomalies, and address potential issues before they escalate into significant problems. To achieve comprehensive observability and management of Exadata systems, we recommend utilizing OCI Observability and Management (O&M) services such as Management Agent Cloud Service, Database Management Service, Ops Insights, and Logging Analytics. These services enable the collection and ingestion of Exadata system metrics and log data across various environments, including OCI, Cloud@Customer, and on-premises deployments.
This article focuses on OCI Log Analytics for Oracle Database@AWS Exadata Database Service on Dedicated Infrastructure (ExaDB-D). The same ZIP-based Management Agent and log-collection model also applies to Exadata Database Service on Cloud@Customer (ExaC@C). The walkthrough covers Management Agent installation, database and Grid Infrastructure (GI) log access, entity and source associations, Log Explorer verification, dashboards, and investigation queries. It builds on Maximizing Visibility: Collecting and Analyzing Logs from Oracle Databases using OCI Logging Analytics.
Oracle’s multicloud database monitoring strategy
Oracle’s multicloud database monitoring strategy combines three complementary OCI Observability and Management services. Database Management provides fleet monitoring, database and infrastructure metrics, performance management, and administration. Ops Insights adds capacity planning, SQL insights, machine-learning-driven diagnostics, and fleet-level trends. Log Analytics centralizes logs from cloud and on-premises environments and applies Oracle-aware parsing, interactive analytics, dashboards, and AI-assisted investigation. Together, these services let operations teams move from a fleet symptom to database performance, capacity, and log evidence without treating any single signal as the complete answer. OCI monitoring for Oracle Database@AWS, Database Management, Ops Insights
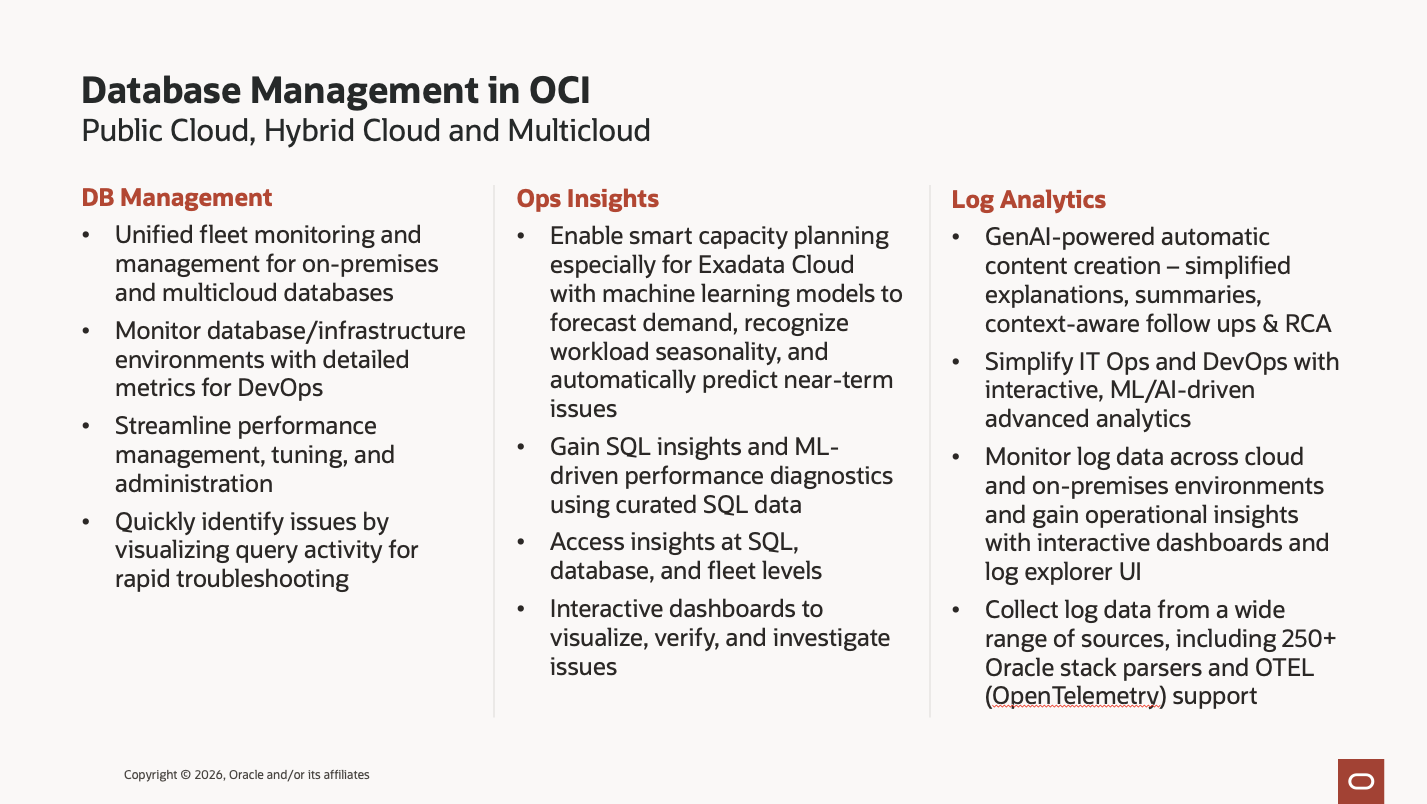
Figure 1. Oracle’s database management strategy combines Database Management, Ops Insights, and Log Analytics across public-cloud, hybrid-cloud, and multicloud database deployments.
Why database and GI logs become difficult to use across a fleet
Oracle Database@AWS publishes useful performance and infrastructure metrics to Amazon CloudWatch under the AWS/ODB namespace. The service view can expose CPU utilization, load, memory, ASM disk-group utilization, node status, allocated OCPUs, file-system utilization, active sessions, and I/O performance, depending on the resource and enabled monitoring. These metrics help operators recognize resource pressure and availability changes across Exadata VM clusters. Oracle Database@AWS CloudWatch monitoring, AWS monitoring overview
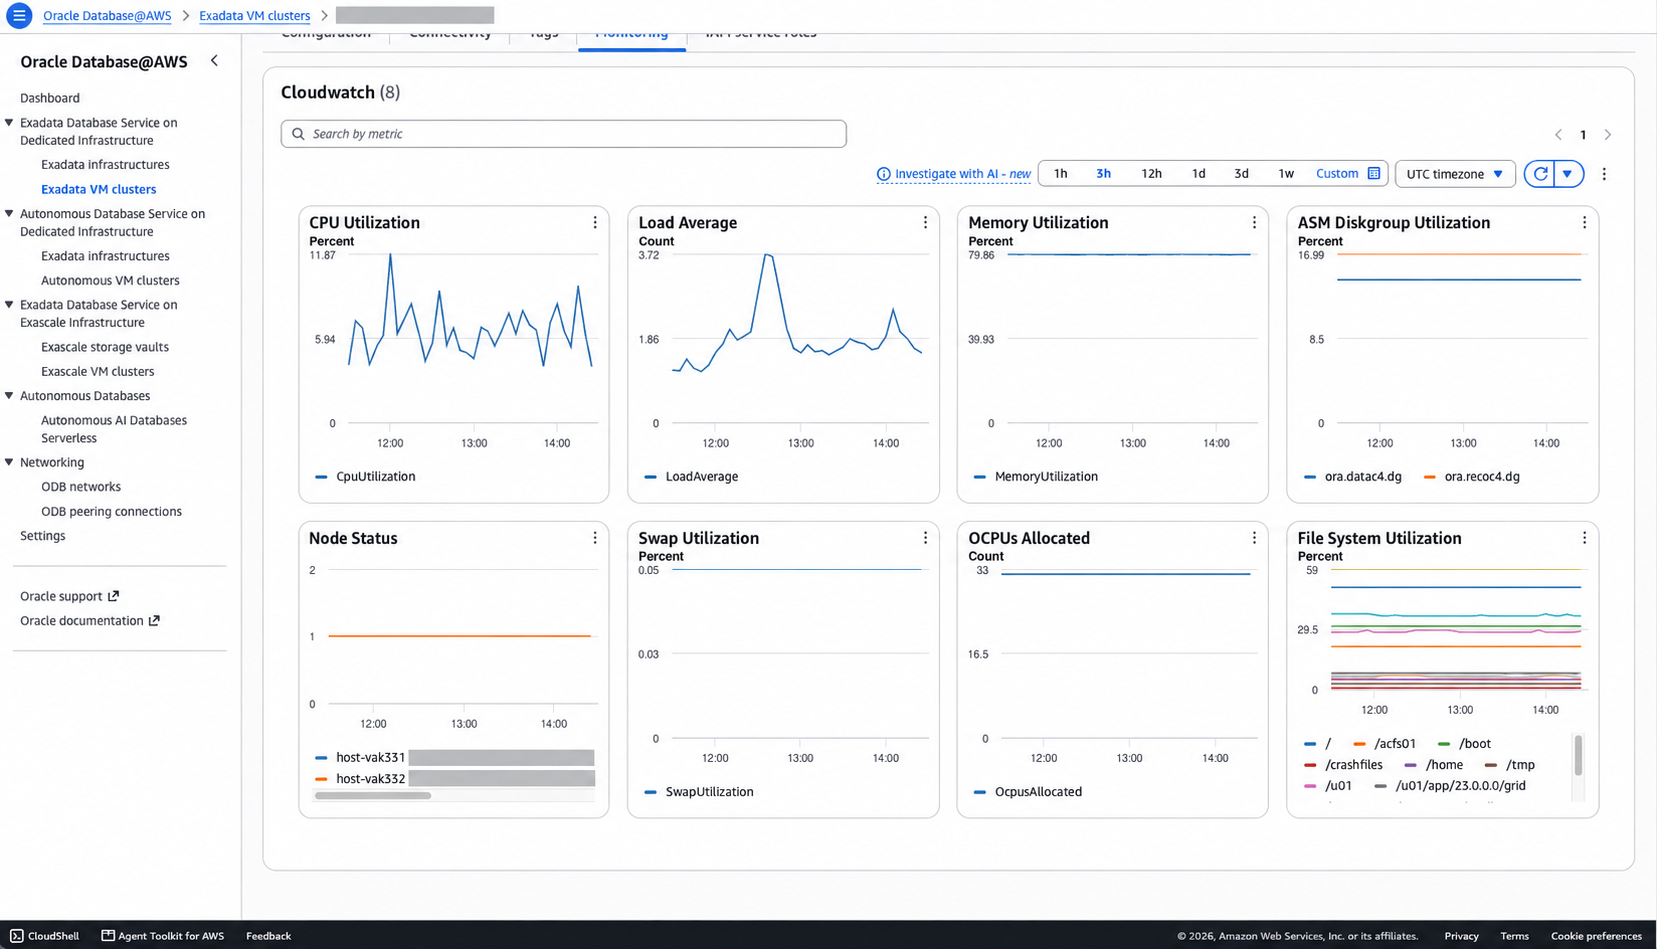
Figure 2. CloudWatch provides useful VM-cluster and database metrics. The VM-cluster name and database-node OCIDs were redacted for publication.
The CloudWatch Logs view captured for this walkthrough primarily exposes the /aws/events/odba_events log group. The example below records a FetchProtectedDatabaseConfiguration operation as an audit-style service event. AWS documents Oracle Database@AWS events as structured messages about resource lifecycle changes, including Exadata infrastructure, VM cluster, CDB, and PDB events. CloudTrail separately records Oracle Database@AWS control-plane API calls. These streams are valuable for tracking provisioning, configuration changes, and administrative activity, but they are different from the diagnostic files generated inside the database servers. Oracle Database@AWS events, Oracle Database@AWS CloudTrail logging
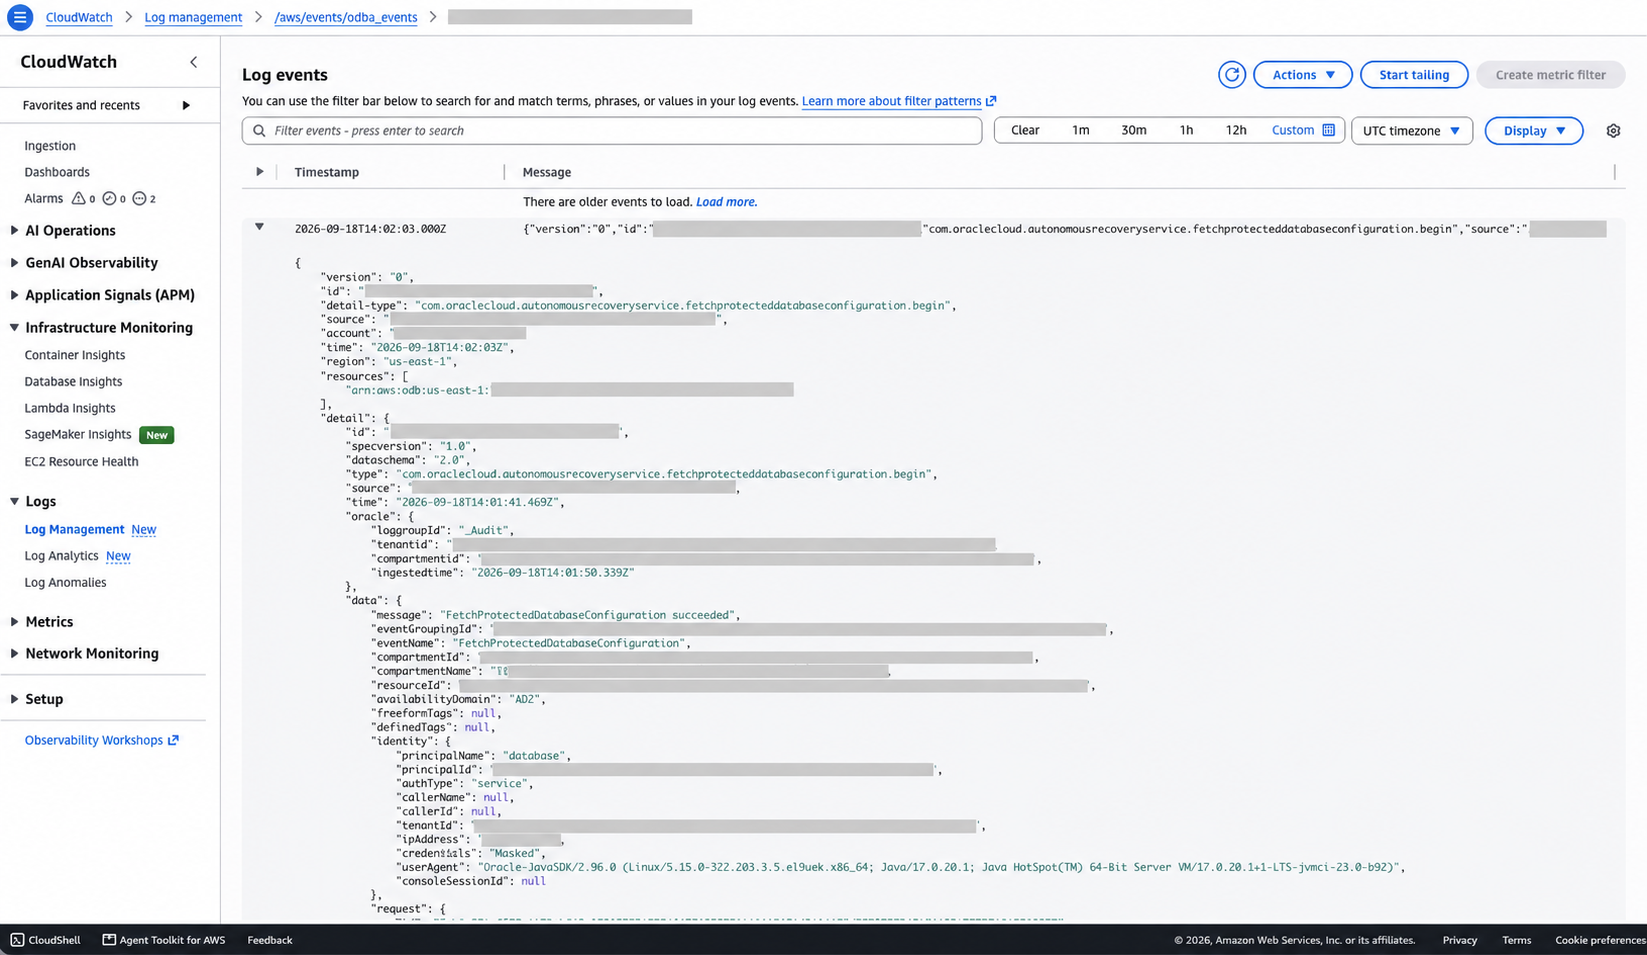
Figure 3. An audit-style Oracle Database@AWS service event in /aws/events/odba_events. Account identifiers, ARNs, OCIDs, event identifiers, the IP address, and other environment-specific values were redacted for publication.
Database alert logs, listener logs, ASM logs, and Clusterware logs are produced on the Exadata database VMs. Without centralized collection, a DBA investigating an ORA-07445, ORA-00600, listener failure, or Clusterware event must connect to the relevant database nodes, traverse the database and Grid Infrastructure diagnostic directory structures, identify the correct instance and time range, and then correlate records across nodes. That process becomes slower and less consistent as the number of VM clusters grows.
Exadata diagnostics are also distributed across components and VM-local directories. A RAC database has instance-specific diagnostics; listeners, ASM, and Clusterware have their own files and ownership. Troubleshooting therefore requires both access to the right files and enough context to know which component produced each record.
As the fleet grows, several practical issues accumulate. Nodes can have different database homes and ADR paths. File access differs between the database owner, GI owner, and collection account. Rotation can remove incident evidence before someone retrieves it. A newly added VM can be missing a source association even though the rest of the cluster is collecting successfully.
Use a small collection inventory to turn those issues into explicit configuration:
| Diagnostic area | Initial operational question | Collection priority |
|---|---|---|
| Database alert | Which instance reported an ORA error, restart, or other significant event? | Baseline |
| Listener | What connection-related messages occurred during the incident? | Baseline |
| Clusterware | Did resource, membership, or service events coincide with the symptoms? | Baseline alert coverage |
| ASM | What storage-management events were visible to the guest cluster? | Baseline alert coverage |
| Database/GI traces and incident dumps | What deeper evidence is needed for this diagnosis? | Targeted collection |
| Audit records | Which auditable actions require investigation or retention? | Separate security use case |
This article collects from customer-accessible Exadata database VMs in Oracle Database@AWS and ExaC@C. Oracle-managed physical hosts and Exadata storage cells have different operating responsibilities. The presence of an Exadata parser in a catalog does not provide customer access to the infrastructure that produces those logs. ExaDB-D responsibility model, ExaC@C architecture
The value of OCI Log Analytics for multicloud databases
The cloud-native operating model is to deploy an OCI Management Agent with the Log Analytics plug-in on every Exadata database VM whose local logs must be monitored. Each agent reads the authorized database and GI files and sends their records to OCI Log Analytics, where the operations team can search, parse, correlate, visualize, and report on them as a fleet. This removes the need to begin every investigation by signing in to each node and manually searching separate diagnostic trees.
For a fleet of ExaDB-D or ExaC@C VM clusters, a useful log service must do more than retain files. Operators need to search the same error across instances, distinguish recurring messages from new patterns, and follow an incident from a database symptom into its listener, GI, and guest-host evidence.
OCI Log Analytics provides log collection, parsing, enrichment, search, and visualization in one service. Its catalog includes more than 250 prebuilt parsers across Oracle and other technologies. That lets a database operations team begin with Oracle-defined content and extend it when a diagnostic format needs custom handling. OCI Log Analytics capabilities, OCI Log Analytics for Oracle Database@AWS
The operational value is a common place to answer concrete questions:
- Scope: Is an error isolated to an instance, repeated on both RAC nodes, or appearing across several VM clusters?
- Sequence: Did a listener failure follow a database event, or did both coincide with a GI event?
- Change: Which message patterns appeared during the incident that were absent in the earlier comparison window?
- Evidence: Which exact records support the working explanation and the handoff to the next operations team?
Build the operating model around OCI Log Analytics
Collect at the VM, investigate across the fleet
Deploy a standalone Management Agent with the Log Analytics plug-in on each guest VM whose local logs you need. Represent the emitting components with Log Analytics entities, associate their sources, and send records to the intended log group. This preserves the instance and node context needed for fleet analysis. Continuous collection workflow
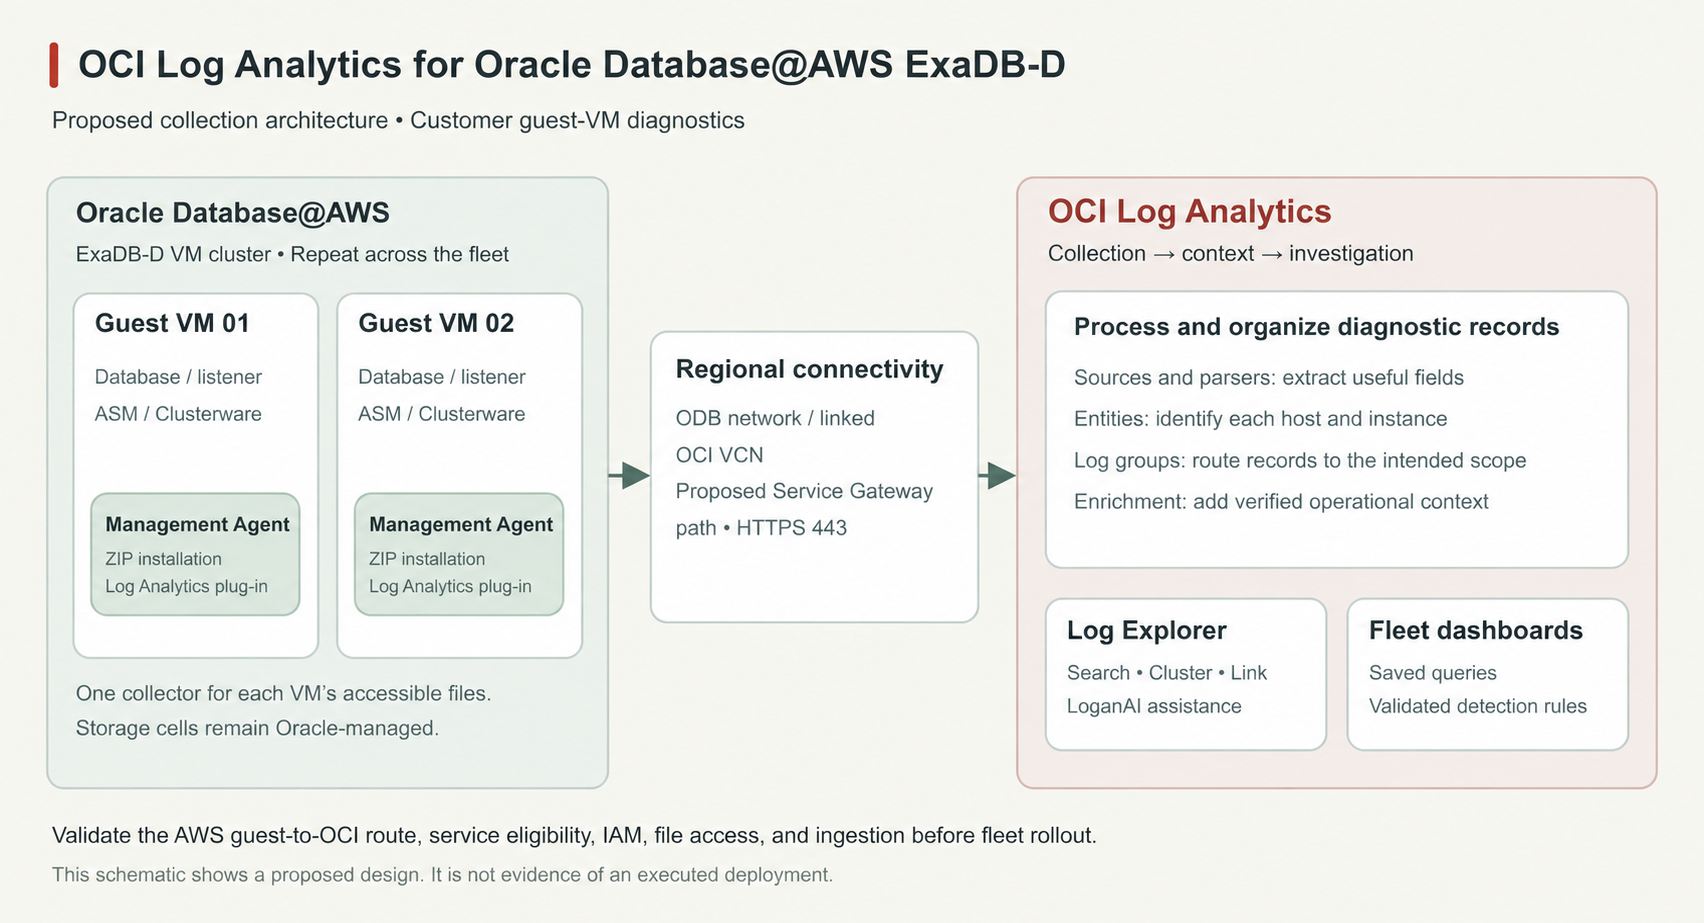
Figure 4. Proposed collection architecture. Each VM contributes its accessible logs to OCI Log Analytics. The regional connectivity path must be validated for the target deployment.
Keep three configuration concepts distinct. A source defines how records are collected and processed; a parser extracts fields; an entity identifies the component that generated them. A log group is the destination for collected records, governed through OCI IAM and compartments. Log Analytics concepts
Create a naming convention such as aws-prod-cluster01-vm01-db01 for an instance entity and record its relationship to the host and VM cluster. Maintain an expected inventory of VMs, instances, and source associations. Where operators need queryable AWS account or cluster dimensions, configure and verify the relevant enrichment; OCI resource tags should not be assumed to appear automatically as fields on every log record.
Establish the AWS-to-OCI collection path
AWS documents that an ODB network corresponds to a VCN in the linked OCI tenancy. Oracle’s Database@AWS security prerequisites illustrate a Service Gateway route to OCI Vault, while the OCI service matrix lists Management Agent, LogAnalytics, Monitoring, and Monitoring Ingestion as supported through Service Gateway. These are the basis for the proposed private service path in Figure 4. They do not replace an end-to-end check of Log Analytics collection from the target guest VM. AWS ODB networking, Oracle Database@AWS network prerequisites, Service Gateway support matrix
Before installing, have the network owner verify the linked OCI region, existing gateway and route configuration, DNS resolution, and permitted HTTPS egress. Relevant endpoint patterns include:
| Purpose | HTTPS destination |
|---|---|
| Management Agent service | management-agent.<region>.oci.oraclecloud.com |
| Log records and collection warnings | loganalytics.<region>.oci.oraclecloud.com |
| Collection metrics | telemetry-ingestion.<region>.oraclecloud.com |
Use the full current prerequisites for the deployment; this table is not an exhaustive allowlist. Validate TLS with certificate verification enabled. A successful connection test establishes reachability, while agent registration and a newly ingested record establish that the collection workflow works. Agent connectivity diagnostics, Log Analytics agent endpoints
Turn records into explanations and repeatable investigations
Log Explorer supports interactive investigation as well as saved queries. Cluster analysis groups recurring message patterns; Link provides ways to analyze related records. Use these capabilities to narrow an incident before reading the underlying messages in detail. Advanced analytics
LoganAI adds generated explanations, summaries, and context-aware follow-up questions for selected logs and visualizations. For example, an operator can ask for a summary of database errors in a time window, then investigate the suggested next question against GI and host evidence. This assists RCA; the operator still verifies the conclusion against the records. Enabling LoganAI requires the documented Generative AI region, IAM, and service prerequisites. LoganAI, Enablement prerequisites
For a broader application-to-database view, OCI Log Analytics also accepts OpenTelemetry logs through the documented UploadOtlpLogs API using OTLP JSON. This is an optional ingestion path for application context; it is separate from the guest-VM file collection configured here. OpenTelemetry log ingestion
Install the Management Agent and configure ExaDB-D and ExaC@C log collection
The procedure below follows Oracle’s public Exadata ZIP installation guidance, which explicitly prohibits RPM installation on Exadata and specifies /u02 for Exadata Cloud in OCI and Cloud@Customer. It applies directly to ExaDB-D in OCI and ExaC@C; this article uses an Oracle Database@AWS ExaDB-D guest VM as the worked example. Before applying the AWS adaptation, confirm the applicable image and lifecycle requirements in MOS 3015115.1, OCI: Observability & Management Support For Exadata Cloud, with Oracle Support when needed. The public guide does not explicitly name AWS in its /u02 statement, and connectivity differs among AWS, OCI, and the customer data center. Exadata installation guidance
Step 1: Establish the OCI destination and permissions
Enable Log Analytics in the chosen OCI region and create the destination log group. Record the region, agent compartment, log-group compartment, and log-group OCID. Keep human administration separate from the identity used by the running collectors.
For example, delegate agent administration to an OCI group, substituting your identity-domain and compartment names:
Allow group <domain>/LogAnalyticsAdmins to manage management-agents in compartment <agent_compartment>
Allow group <domain>/LogAnalyticsAdmins to manage management-agent-install-keys in compartment <agent_compartment>
Allow group <domain>/LogAnalyticsAdmins to read metrics in compartment <agent_compartment>
These statements cover agent administration. For Log Analytics configuration, use an existing authorized role or add the following service permissions, applying resource access to each compartment containing entities or log groups:
Allow group <domain>/LogAnalyticsAdmins to use loganalytics-features-family in tenancy
Allow group <domain>/LogAnalyticsAdmins to use loganalytics-resources-family in compartment <log_configuration_compartment>
Allow group <domain>/LogAnalyticsAdmins to manage management-dashboard-family in compartment <dashboard_compartment>
Allow group <domain>/LogAnalyticsAdmins to read compartments in tenancy
Allow service loganalytics to read loganalytics-features-family in tenancy
Initial service enablement requires the documented administrator access; the onboarding workflow may have already created the service policy. Features-family permissions are tenancy-wide, while resource-family permissions can be compartment-scoped. Log Analytics access setup
Have an authorized IAM administrator create the policies and a dynamic group for collectors in the agent compartment:
ALL {resource.type='managementagent', resource.compartment.id='<agent_compartment_ocid>'}
Grant this group permission to upload logs, emit collection metrics, and read tenancy user information. Oracle’s policy templates support selecting the destination compartments for the first two grants; READ USERS is tenancy-scoped:
Allow dynamic-group <domain>/LogAnalyticsAgents to {LOG_ANALYTICS_LOG_GROUP_UPLOAD_LOGS} in compartment <log_group_compartment>
Allow dynamic-group <domain>/LogAnalyticsAgents to use metrics in compartment <collection_metrics_compartment>
Allow dynamic-group <domain>/LogAnalyticsAgents to read users in tenancy
Match the dynamic group’s compartment to the install key’s compartment. Select the metrics compartment actually used by your collector configuration. IAM authorizes the agent’s OCI operations; filesystem permissions separately determine which local logs it can read. Continuous-collection IAM policies, compartment-scoped templates, automatic-ingestion policy example
Step 2: Verify host prerequisites
Complete the network validation in Section 3 before continuing on each VM.
Confirm sudo access, time synchronization, adequate free space on /u02, and that the host has unzip. The observed 260729.1846 installer checks JAVA_HOME first and then /usr/bin/java; on the validated guest it found Java 1.8.0_491. Before installation, verify that root can read and execute the supported Java runtime. Set JAVA_HOME only when the required Java is not available through the default path, then verify it from the root shell. Follow the prerequisites for the exact agent release. Management Agent installation
The examples use the host’s unzip utility. Confirm it is available before the installation window.
Step 3: Prepare the ZIP installation
Download the Linux ZIP and its published SHA-256 checksum from Management Agent administration. Create a time-limited install key for the planned node count and download its response-file template. Transfer these through your approved administration channel.
For a new installation, confirm that /opt/oracle already exists, then create the external-volume target and the symbolic link exactly as the documented ZIP procedure specifies:
sudo mkdir -p /u02/app/oracle/mgmt_agent
sudo ln -s /u02/app/oracle/mgmt_agent /opt/oracle/mgmt_agent
Do not run these commands over an existing agent directory or symlink; inspect an existing deployment before changing it. The installer creates and owns the default mgmt_agent operating-system user. Do not pre-create a group, user, or custom home solely for this procedure. The /u02 requirement applies to the agent installation directory, not to the account home. Management Agent installation
Step 4: Extract, configure, and install
Use the Exadata layout from the earlier A-Team procedure: create install_dir below the external /u02 agent path and extract the Linux ZIP there. Because the directory is created with sudo and is normally owned by root at this point, this example also uses sudo for extraction. This avoids depending on whether the staging user can write to the new directory.
sudo mkdir -p /u02/app/oracle/mgmt_agent/install_dir
sudo unzip /home/opc/oracle.mgmt_agent.260729.1846.Linux-x86_64.zip \
  -d /u02/app/oracle/mgmt_agent/install_dir
cd /u02/app/oracle/mgmt_agent/install_dir/mgmt_agent
The observed ZIP creates a nested mgmt_agent directory containing installer.sh; running the installer from install_dir itself returns No such file or directory. The ZIP filename and /home/opc source path reflect the observed environment. Before extracting, compare the ZIP’s sha256sum output with the checksum in Management Agent administration, as Oracle recommends.
Before opening the root shell or running the installer, edit and securely save mgmt_agent_exadbd.rsp. Use the downloaded install key in the local file, but never capture it in screenshots, tickets, or source control. The following is a screenshot-safe rendering: it retains the observed display name and plug-in options while redacting the sensitive value.
# Do not replace this marker with the actual key in screenshots or published material.
ManagementAgentInstallKey = <REDACTED-INSTALL-KEY>
AgentDisplayName = odb-aws-host-vak331

#FreeFormTags = [{"<key1>":"<value1>"}, {"<key2>":"<value2>"}]
#DefinedTags = [{"namespace1":{"<key1>":"<value1>"}}, {"namespace2":{"<key2>":"<value2>"}}]
#CredentialWalletPassword =
#Service.plugin.jm-container.download=true
#Service.plugin.appmgmt.download=true
#Service.plugin.jms.download=true
#Service.plugin.dbaas.download=true
Service.plugin.logan.download=true
#Service.plugin.mds.download=true
#Service.plugin.osmh.download=true
#Service.plugin.opsiHost.download=true
#Service.plugin.jm.download=true
#Service.plugin..startup.jersey.hotpath.1.2f97483d-2052-4ce7-b18e-59a835d599c4.plugin.download=true
Only Service.plugin.logan.download=true is enabled in this response file; the remaining shown plug-in options are commented out. Add required defined tags and any approved gateway settings from your environment. Do not paste the key into shell history. The response file contains the installation key, so retain it in the approved protected transfer location and delete or store it securely after successful registration. Oracle requires the response file and every parent directory to be accessible to the mgmt_agent OS user.
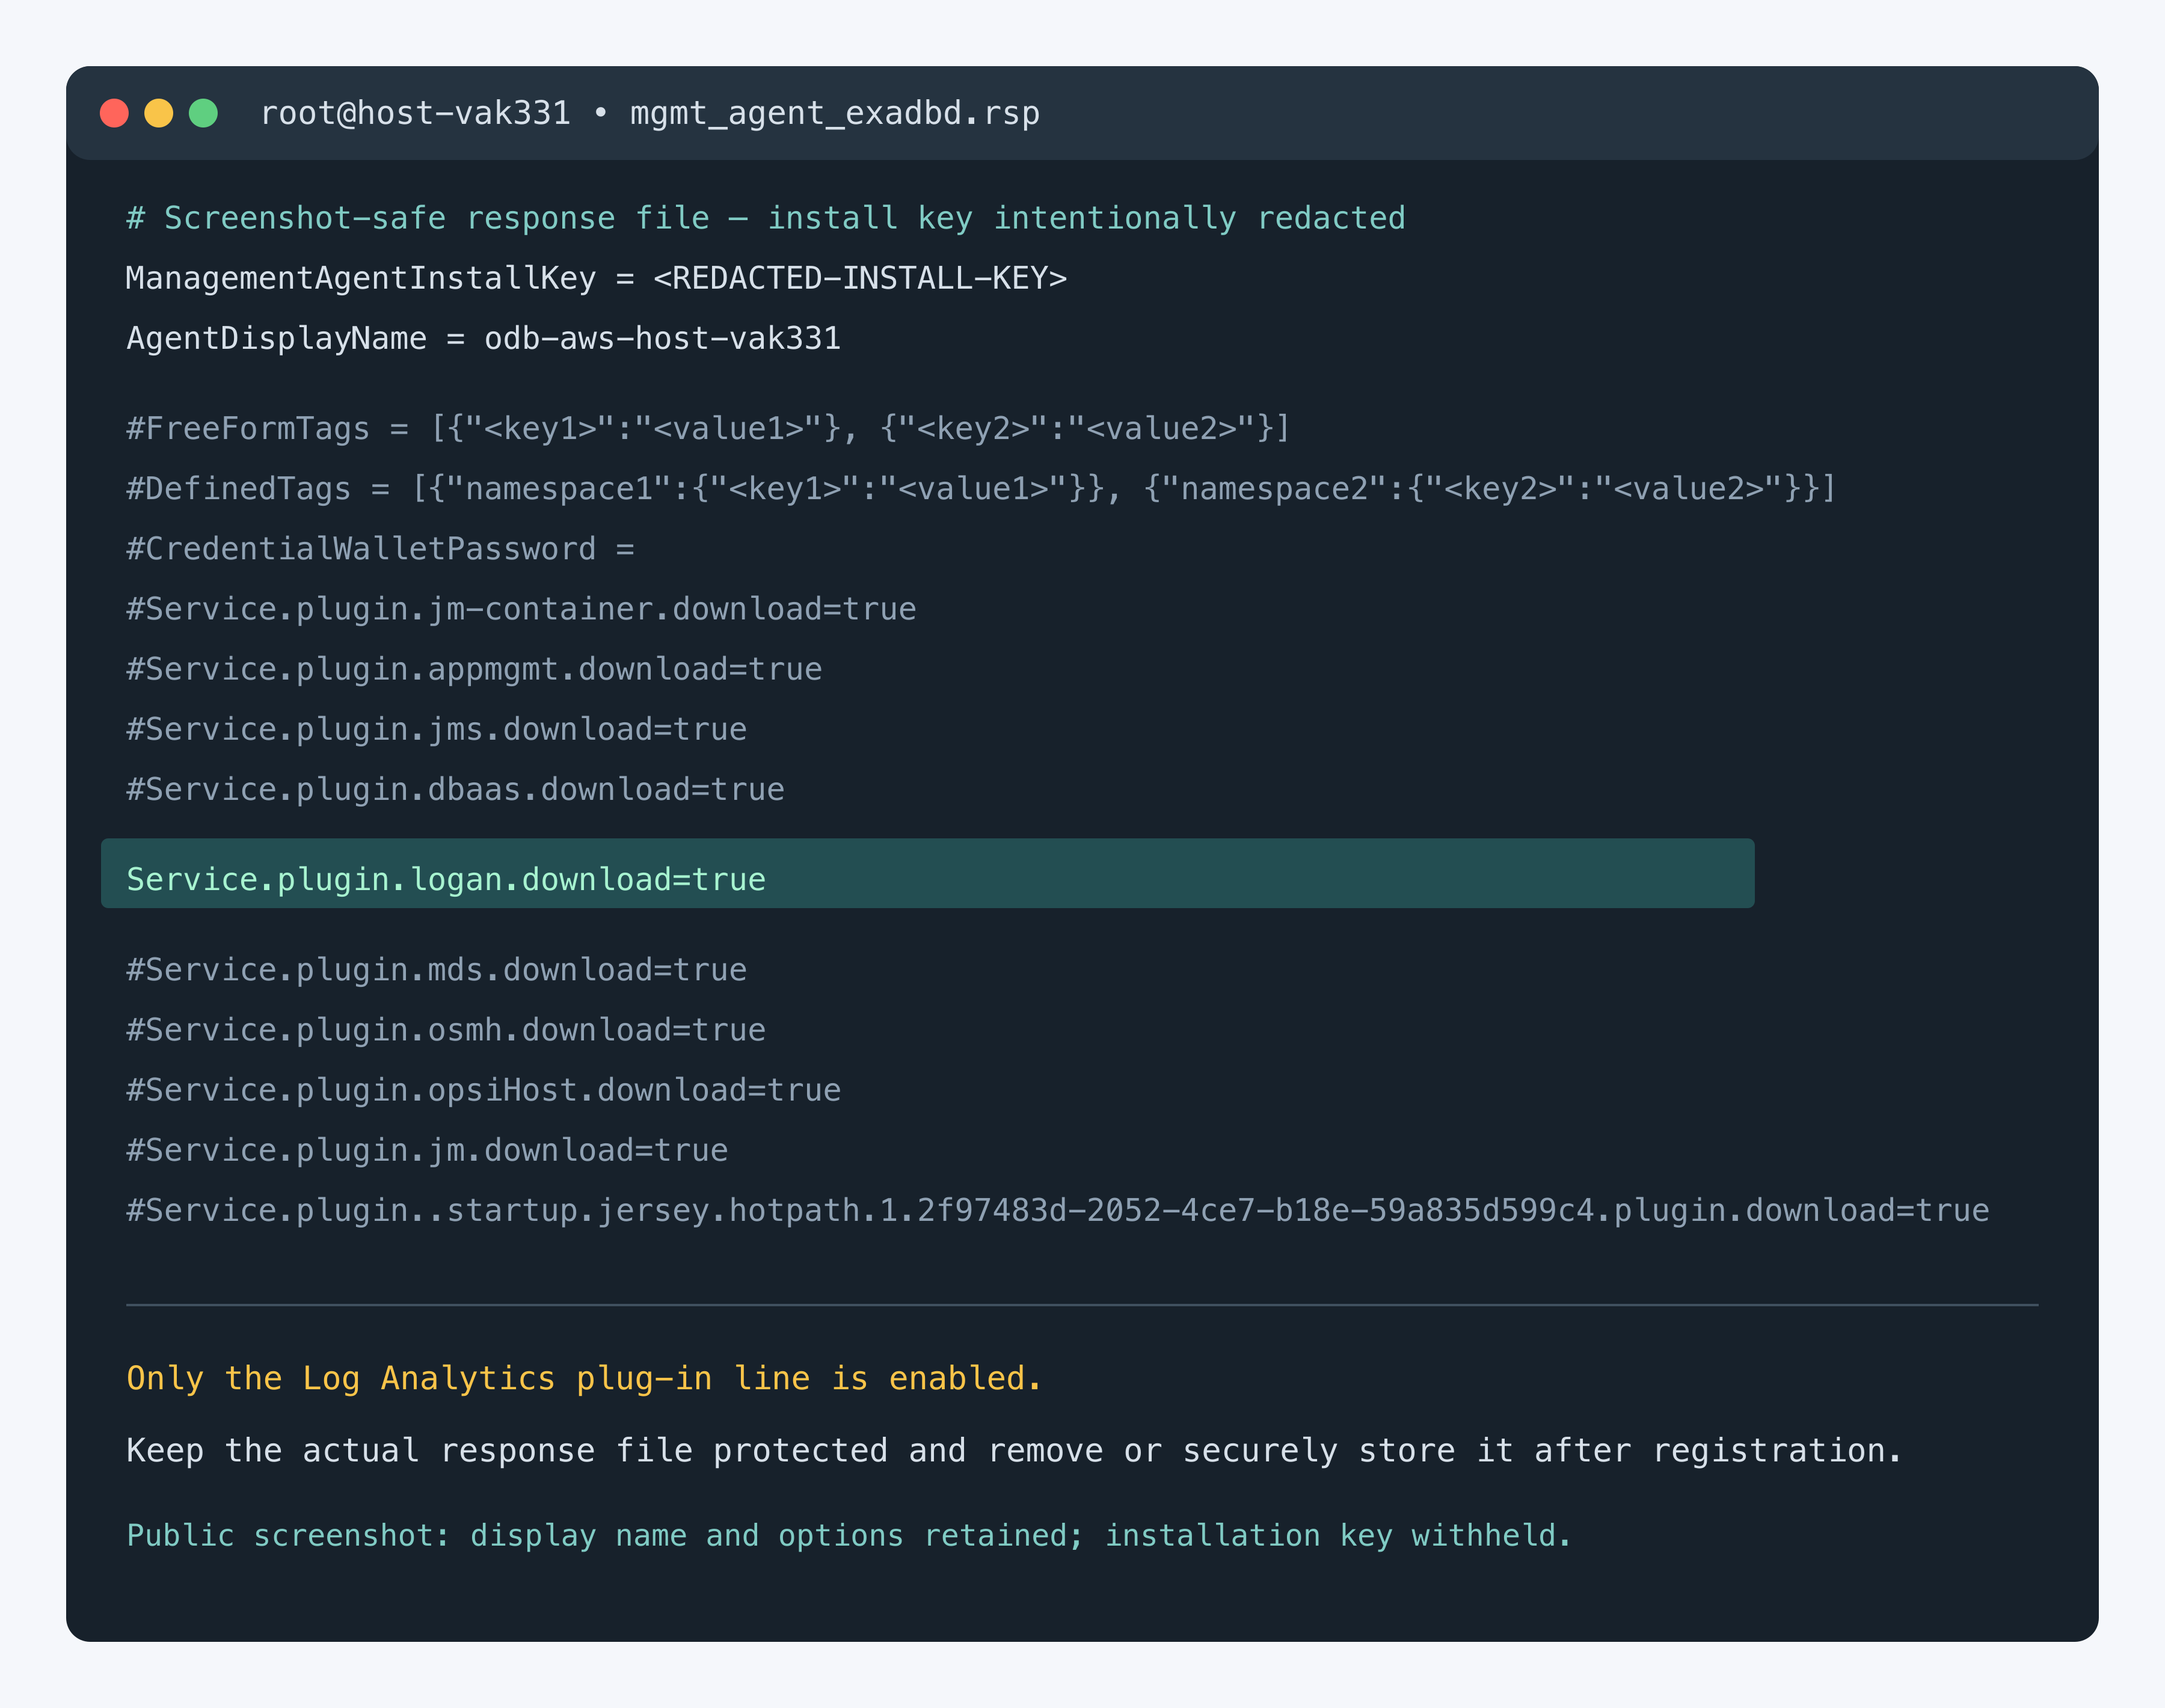
Figure 5. Screenshot-safe rendering of mgmt_agent_exadbd.rsp; the install key is redacted, while the observed agent display name and response-file options are retained.
Important — stage the response file in /tmp before running installer.sh. The installer creates mgmt_agent and then configures the agent as that user. A response file under /home/opc may be unreadable because of parent-directory permissions. Copy the completed response file to /tmp, then grant only the temporary read access required during bootstrap:
sudo cp /home/opc/mgmt_agent_exadbd.rsp /tmp/mgmt_agent_exadbd.rsp
sudo chmod 0644 /tmp/mgmt_agent_exadbd.rsp
The validated troubleshooting session used mode 777, which proved that permissions caused the failure. Do not use 777 in the published procedure: the response file contains an install key, and mode 777 lets every local user read, modify, and execute it. Mode 0644 is the minimum practical bootstrap permission before the installer creates mgmt_agent; remove the file immediately after successful configuration.
After the response file is saved and accessible to the agent user, explicitly change into the nested directory that contains installer.sh, then open a root shell:
cd /u02/app/oracle/mgmt_agent/install_dir/mgmt_agent
sudo /bin/bash
At the root-shell prompt, start the installation:
export OPT_ORACLE_SYMLINK=true
./installer.sh /tmp/mgmt_agent_exadbd.rsp
If installation succeeds but agent configuration fails
The observed installation completed the software copy and service creation, then failed configuration because the new mgmt_agent user could not read /home/opc/mgmt_agent_exadbd.rsp. This is a partial success: do not reinstall the ZIP. Review the configure log first:
The following host output was captured before the /tmp correction, when installer.sh received the response file under /home/opc. It shows the distinction between successful software installation and failed agent configuration:
Checking pre-requisites
        Checking if any previous agent service exists
        Checking if OS has systemd or initd
        Checking available disk space for agent install
        Checking if /opt/oracle/mgmt_agent directory exists
        Checking if 'mgmt_agent' user exists
        'mgmt_agent' user does not exist. Proceeding to create the user...
        User home directory is valid and writable. Proceeding with user creation...
        Creating user on Linux-based OS...
        Checking Java version
                JAVA_HOME is not set or not readable to root
                Trying default path /usr/bin/java
                Java version: 1.8.0_491 found at /usr/bin/java
        Checking agent version

Executing install
        Unpacking software zip
        Copying files to destination dir (/opt/oracle/mgmt_agent)
        Initializing software from template
        Checking if JavaScript engine is available to use
        Creating mgmt_agent daemon
        Agent Install Logs: /opt/oracle/mgmt_agent/installer-logs/installer.log.0

Agent install successful

/home/opc/mgmt_agent_exadbd.rsp file is either not present or not readable to mgmt_agent user
Please make sure that the directory and parent directories also have the read permissions to make this file readable.

You may execute the following commands to make sure mgmt_agent user can read input.rsp:
cd /tmp
sudo -u mgmt_agent cat <FULL_PATH>/input.rsp

Missing mandatory properties opts
Usage: setup.sh opts=<FULL-PATH>
Please make sure there is no space in between opts=<FULL-PATH>

Executing configure

Prerequisite check failed
Pass opts=<> to application at the startup
Additional details are available in the configure logs at /u02/app/oracle/mgmt_agent/configure-logs

Agent configure failed.
Additional logs can be found at /opt/oracle/mgmt_agent/configure-logs/configure.log.0
sudo tail -n 200 /opt/oracle/mgmt_agent/configure-logs/configure.log.0
sudo -u mgmt_agent cat /home/opc/mgmt_agent_exadbd.rsp >/dev/null
If the second command reports Permission denied, copy the response file to /tmp. Because mgmt_agent now exists, assign the file directly to that user with mode 0600, then verify access without printing the install key:
sudo cp /home/opc/mgmt_agent_exadbd.rsp /tmp/mgmt_agent_exadbd.rsp
sudo chown mgmt_agent:mgmt_agent /tmp/mgmt_agent_exadbd.rsp
sudo chmod 0600 /tmp/mgmt_agent_exadbd.rsp
sudo -u mgmt_agent cat /tmp/mgmt_agent_exadbd.rsp >/dev/null
Rerun only the configuration step. The opts= argument is mandatory and must not contain spaces around the equals sign:
sudo /opt/oracle/mgmt_agent/agent_inst/bin/setup.sh \
  opts=/tmp/mgmt_agent_exadbd.rsp
The corrected retry produced the following successful configuration output:
Executing configure
        Parsing input response file
        Validating install key
        Generating communication wallet
        Generating security artifacts
        Registering Management Agent
                Found service plugin(s): [logan]

Starting agent...
Agent started successfully

Starting plugin deployment for: [logan]
Deploying service plugin(s)...Done.
logan : Successfully deployed service plugin

Agent setup completed and the agent is running.
In the future agent can be started by directly running: sudo systemctl start mgmt_agent
Please use OCI CLI or OCI Management Agent console to validate the successful activation of your agent.

Please make sure that you delete /tmp/mgmt_agent_exadbd.rsp or store it in secure location.
On the validated guest, this retry completed install-key validation, wallet generation, registration, agent startup, and deployment of the logan plug-in. If configuration fails again, preserve /opt/oracle/mgmt_agent/configure-logs/configure.log.0 and check the exact reported cause. Common next checks are an expired or exhausted install key, incorrect gateway/proxy parameters, and DNS, TLS, or TCP 443 connectivity to the configured OCI regional endpoint. Correct the response file or connectivity issue, verify readability again as mgmt_agent, and rerun the same setup.sh opts=... command. Management Agent setup
After setup succeeds and the agent appears active in OCI, remove the temporary response file:
sudo rm -f /tmp/mgmt_agent_exadbd.rsp
Step 5: Validate the agent and plug-in
Check the process and physical location:
systemctl status mgmt_agent --no-pager
readlink -f /opt/oracle/mgmt_agent
grep -F 'packageType=ZIP' \
  /opt/oracle/mgmt_agent/agent_inst/config/security/resource/agent.package
rpm -qa | grep -i mgmt_agent || true
stat -c '%U %n' /opt/oracle/mgmt_agent
stat -c '%U %n' /opt/oracle/mgmt_agent/agent_inst
systemctl confirms the service state. readlink confirms that /opt/oracle/mgmt_agent resolves to the /u02 installation target; agent.package must report packageType=ZIP; the RPM query must produce no Management Agent package; and both ownership checks must report mgmt_agent.
Next, validate registration and communication in the Management Agent Cloud Service:
- In the OCI Console, select the region where the Management Agent resources were created.
- Open Observability & Management → Management Agent → Agents and select the agent compartment.
- Search for the node-specific
AgentDisplayName, such asodb-aws-host-vak331orodb-aws-host-vak332. - Confirm that Availability is Active, Operating system is LINUX, and Version matches the installed ZIP build. Review Upgrade for any required update.
- Confirm that Service plug-ins lists Log Analytics. Open the agent details and verify that the Log Analytics plug-in status is Running.
- Repeat the check for every database node and reconcile the console list with the planned VM-cluster inventory. Management Agent console
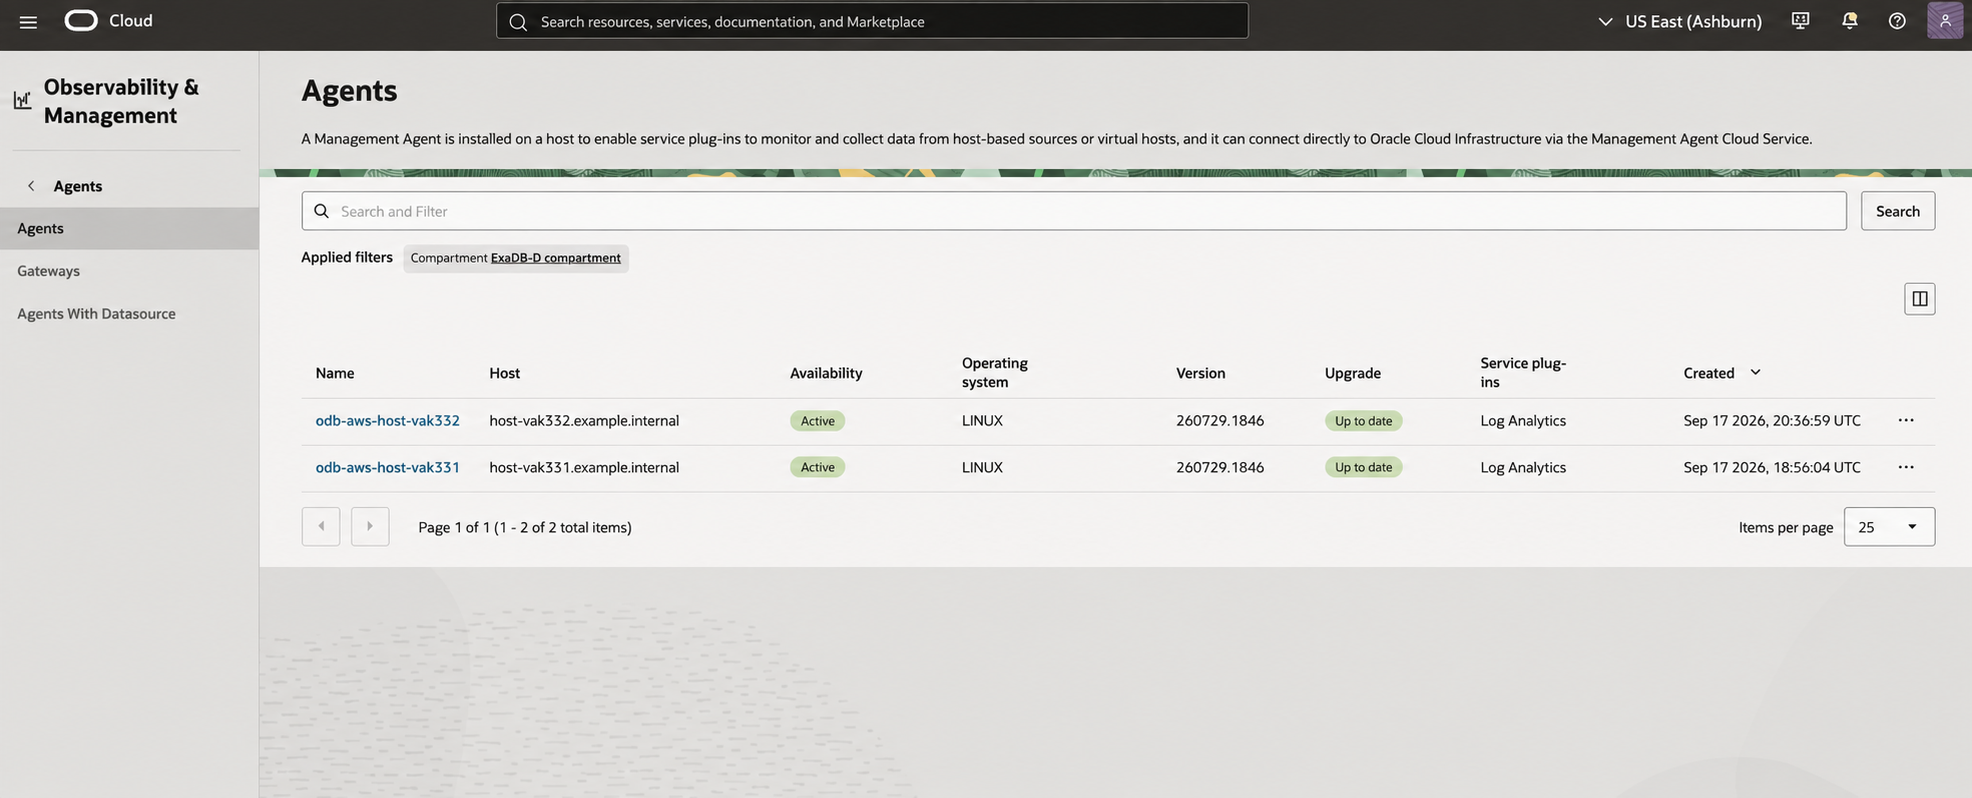
Figure 6. Management Agent Cloud Service validation for two ExaDB-D database nodes. Both agents are active on version 260729.1846, show Up to date, and list the Log Analytics plug-in. The compartment identifier and private DNS suffixes were replaced for publication.
An Active agent establishes cloud registration and recent Management Agent communication; it does not by itself prove that database or GI logs are being ingested. Associate the intended host, database, and cluster entities and sources, then verify a recent event from each node in Log Explorer. Check collection warnings and metrics, and test rotated or newly created files as well as existing files. For selected log paths, use ACLs that grant directory traversal and file read access, including appropriate default ACLs. Log permissions
For this Log Analytics-focused article, Service.plugin.logan.download=true is the only required plug-in. Enable Database Management or Ops Insights only when those services are part of the deployment; they are not prerequisites for collecting database or GI logs in OCI Log Analytics. If the Log Analytics plug-in was not enabled in the response file, it can instead be deployed from the Management Agent page in the OCI Console. Earlier A-Team procedure
Step 6: Install and configure the agent on every database node
After the first database node completes configuration and passes the Step 5 checks, copy the same Management Agent ZIP and a protected copy of the response-file template to every remaining Exadata database node. Install a separate Management Agent locally on each node whose database or GI files must be collected. Do not copy the installed /u02/app/oracle/mgmt_agent directory from one node to another.
Before reusing the response file, open Observability & Management → Management Agent → Administration → Install keys. Confirm that the key is active and that its remaining installations can accommodate all remaining nodes. Create or download a new install key when the existing key is expired, exhausted, or its Maximum installations setting does not cover the planned node count. Install-key administration
Use the approved encrypted transfer method for the environment. For example, from the node or staging host that currently holds the two files:
target_dbnode=host-vak332
scp /home/opc/oracle.mgmt_agent.260729.1846.Linux-x86_64.zip \
  /home/opc/mgmt_agent_exadbd.rsp \
  opc@"$target_dbnode":/home/opc/
ssh opc@"$target_dbnode" \
  'chmod 0600 /home/opc/mgmt_agent_exadbd.rsp'
Treat the copied response file as a template. On the target node, change AgentDisplayName to a node-specific value before staging the file in /tmp. This makes every database node easy to identify in the Management Agent and Log Analytics consoles. For example:
AgentDisplayName = odb-aws-host-vak332
Retain the validated install key and Service.plugin.logan.download=true, along with any approved tags or gateway settings that apply to that node. Then repeat Steps 2–5 on the target node: complete the preflight checks, create the /u02 target and /opt/oracle/mgmt_agent symlink, extract the ZIP, stage the response file, run installer.sh, validate packageType=ZIP, and confirm that the agent and logan plug-in are active. Apply the emd.properties and 2 GB heap baseline below, restart the agent, and validate log collection from that node.
Repeat this sequence for every database node in every VM cluster. Confirm a distinct active agent and current log records for each node in OCI Log Analytics. After a node is registered successfully, delete its temporary response-file copies as described in Step 4. Keep any retained master copy only in the approved secret-management location.
Best practice: establish an Exadata Management Agent baseline
For an ExaDB-D or ExaC@C fleet that collects database and GI logs, start with the following Management Agent properties. Back up emd.properties, edit the original file, and add the settings in its additional-properties section:
sudo cp -p \
  /opt/oracle/mgmt_agent/agent_inst/config/emd.properties \
  /opt/oracle/mgmt_agent/agent_inst/config/emd.properties.pre-exadbd-baseline
sudo vi /opt/oracle/mgmt_agent/agent_inst/config/emd.properties
loganalytics.enable_large_dir=true

# Sender properties
senderManagerMaxDiskUsedTotal=1000
_senderManagerPoolSize=10

# Connection pooling properties
clientConnectionPool.SERVICE_INVOKING.defaultMaxConnectionsPerRoute=50
clientConnectionPool.SERVICE_INVOKING.maxTotalConnections=100
Treat these values as the starting baseline for this Exadata use case. Adjust them according to the number of VM clusters, databases, PDBs, enabled log sources, files created per hour, and observed collection backlog. Validate changes first on a representative VM cluster and monitor agent CPU, memory, disk use, collection latency, and errors before applying them across the fleet. The larger examples in the earlier A-Team sizing table are planning references rather than a universal certified profile.
Oracle defines a large log directory as one containing more than 10,000 files. loganalytics.enable_large_dir=true allows the agent to monitor such directories, but it can increase heap, disk, inode, and open-file demand. Clean up files that no longer need collection and confirm host capacity before enabling high-volume sources. Large-directory configuration
For this standalone Management Agent deployment, configure a 2 GB maximum Java heap as the Exadata fleet baseline. Oracle documents 512 MB as the out-of-box maximum heap for a standalone Management Agent; 2 GB is the operational baseline used in this article, not the product default. Back up java.options, confirm the current active -Xmx entry, and replace it with -Xmx2048m:
sudo cp -p \
  /opt/oracle/mgmt_agent/agent_inst/config/java.options \
  /opt/oracle/mgmt_agent/agent_inst/config/java.options.pre-2gb-heap
sudo grep -n '^-Xmx' \
  /opt/oracle/mgmt_agent/agent_inst/config/java.options
sudo vi /opt/oracle/mgmt_agent/agent_inst/config/java.options
-Xmx2048m
Restart the agent once after both files are updated, then verify the service, heap entry, and Management Agent properties:
sudo systemctl restart mgmt_agent
sudo systemctl status mgmt_agent --no-pager
sudo grep -n '^-Xmx' \
  /opt/oracle/mgmt_agent/agent_inst/config/java.options
sudo grep -E \
  '^(loganalytics\.enable_large_dir|senderManagerMaxDiskUsedTotal|_senderManagerPoolSize|clientConnectionPool\.SERVICE_INVOKING\.(defaultMaxConnectionsPerRoute|maxTotalConnections))=' \
  /opt/oracle/mgmt_agent/agent_inst/config/emd.properties
The following output from host-vak331 confirms the physical /u02 configuration path and the configured 2 GB heap. The -XX:+HeapDumpOnOutOfMemoryError option was also present in the installed file:
[root@host-vak331 config]# pwd
/u02/app/oracle/mgmt_agent/agent_inst/config

[root@host-vak331 config]# cat java.options
#encoding=UTF-8

#These java.options contain user supplied extensions to the options set in wrapper.conf.

#If you modify this file, please make sure that you restart the mgmt_agent service.

#Note: Please do not delete this file. Deleting this file will cause agent failures.

#Add each additional parameter on new line

#------------------------------------------------------------------------------------------------
-Dpolyglot.engine.AllowExperimentalOptions=true
-Dpolyglot.js.nashorn-compat=true
-Djdk.tls.client.protocols=TLSv1.3,TLSv1.2
-Djdk.tls.server.protocols=TLSv1.3,TLSv1.2

-Doracle.polaris.fips.approved_only=false
-XX:+HeapDumpOnOutOfMemoryError
-Dio.netty.native.workdir=/u02/app/oracle/mgmt_agent/agent_inst/tmpdir
-Dio.netty.tmpdir=/u02/app/oracle/mgmt_agent/agent_inst/tmpdir

-Dorg.newsclub.net.unix.library.tmpdir=/u02/app/oracle/mgmt_agent/agent_inst/tmpdir

-Dorg.bouncycastle.native.cpu_variant=java
-Xmx2048m
The same host showed the requested Log Analytics sender and connection-pool baseline at the end of emd.properties:
[root@host-vak331 config]# tail -10 emd.properties
################################
loganalytics.enable_large_dir=true

#Sender properties
senderManagerMaxDiskUsedTotal=1000
_senderManagerPoolSize=10

# Connection pooling properties

clientConnectionPool.SERVICE_INVOKING.defaultMaxConnectionsPerRoute=50
clientConnectionPool.SERVICE_INVOKING.maxTotalConnections=100
[root@host-vak331 config]#
The file output above validates the saved configuration. After the restart, the following systemctl output confirmed that the service was enabled and active. It also showed the wrapper and Java process running from the physical /u02/app/oracle/mgmt_agent installation. Long process arguments were truncated by systemctl in the captured terminal:
[root@host-vak331 config]# sudo systemctl status mgmt_agent --no-pager
● mgmt_agent.service - mgmt_agent
   Loaded: loaded (/etc/systemd/system/mgmt_agent.service; enabled; vendor preset: disabled)
   Active: active (running) since Thu 2026-09-17 20:08:40 UTC; 3s ago
  Process: 348607 ExecStop=/u02/app/oracle/mgmt_agent/agent_inst/bin/agentcore stop sysd (code=exited, status=0/SUCCESS)
  Process: 350167 ExecStart=/u02/app/oracle/mgmt_agent/agent_inst/bin/agentcore start sysd (code=exited, status=0/SUCCESS)
 Main PID: 350257 (wrapper)
    Tasks: 73 (limit: 319999)
   Memory: 562.9M
   CGroup: /system.slice/mgmt_agent.service
           ├─350257 /u02/app/oracle/mgmt_agent/agent_inst/bin/./wrapper /u02/app/oracle/mgmt_agent/agent_inst/bin/../config/wrapper.conf wrapper.syslog.ident=mgmt_agent wrapper.pidfile=/u02/app/oracle/mgm…
           └─350326 /usr/lib/jvm/jdk-1.8.0_491-oracle-x64/bin/java -Dorg.tanukisoftware.wrapper.WrapperSimpleApp.maxStartMainWait=5 -Djava.security.egd=file:///dev/./urandom -Dpolyglot.engine.AllowExperim…

Sep 17 20:08:28 host-vak331 systemd[1]: Starting mgmt_agent...
Sep 17 20:08:28 host-vak331 agentcore[350167]: Starting mgmt_agent...
Sep 17 20:08:35 host-vak331 agentcore[350167]: Waiting for mgmt_agent.........
Sep 17 20:08:40 host-vak331 agentcore[350167]: .....running: PID:350257
Sep 17 20:08:40 host-vak331 systemd[1]: Started mgmt_agent.
Together, the saved-file output and this post-restart service status validate the 2 GB heap and Management Agent property change on host-vak331. Continue monitoring memory, agent logs, and collection backlog as workload is added.
Troubleshoot: the agent reports OutOfMemoryException
An agent can run out of heap when its assigned collection load exceeds the configured maximum. Check the active -Xmx value and recent service messages first:
sudo grep -n '^-Xmx' \
  /opt/oracle/mgmt_agent/agent_inst/config/java.options
sudo journalctl -u mgmt_agent -n 100 --no-pager
If the standalone agent is still using the 512 MB default, apply the 2 GB procedure above, restart the service, and verify that it remains active. If the exception continues at 2 GB, confirm that the VM has sufficient available memory, then review file counts, log-generation rate, enabled sources, collection backlog, and other plug-in workloads before increasing the heap again. Preserve the agent logs and engage Oracle Support when the failure persists with a supported configuration. Management Agent OutOfMemoryException troubleshooting
After successful registration, remove the response file and downloaded installation artifacts from their transfer locations, or store them in the approved secret location. Record node, agent OCID, source associations, and verification time before repeating the process. For ExaC@C, retain the ZIP and /u02 approach; adapt connectivity to the customer’s approved OCI egress path or Management Gateway, then apply the same collection checks.
Adapt the deployment prerequisites for OCI ExaDB-D and ExaC@C
The source/entity configuration and verification steps are reusable across the fleet. Apply each environment’s network and support requirements before reusing the commands:
| Deployment | Installation and connectivity adaptation |
|---|---|
| Oracle Database@AWS ExaDB-D | Validate AWS guest-image support for this ZIP procedure and the regional collection path through the linked OCI network. |
| ExaDB-D in OCI | Use the documented Exadata ZIP and /u02 procedure; verify the guest subnet’s route and egress to the required regional services. |
| ExaC@C | Use the documented ZIP and /u02 procedure; arrange connectivity from the customer guest network through the approved egress, proxy, or Management Gateway path. Do not assume the infrastructure management connection provides this path. |
Use the same per-VM agent, log-access, source-association, and recent-record checks in each deployment. Follow the current installation guidance and host/network prerequisites.
Associate database and GI logs with the right entities
After the agent and plug-in are available, build the collection model for each VM. Use the actual source definitions in your tenancy, including their required entity properties and file patterns. The following Oracle-defined sources provide a useful starting point. Source catalog
| Source | Entity type |
|---|---|
Database Alert Logs |
Oracle Database Instance |
Database Listener Alert Logs |
Oracle Database Listener |
Automatic Storage Management Alert Logs |
Automatic Storage Management Instance |
Clusterware Ready Services Alert Logs |
Oracle Cluster Node |
Clusterware Ready Services Daemon Logs |
Oracle Cluster Node |
Clusterware Disk Monitor Logs |
Oracle Cluster Node |
For database diagnostics, connect through your approved DBA session and discover the active ADR paths:
SELECT name, value
FROM v$diag_info
ORDER BY name;
Record the ADR home and trace directory for the particular instance. Repeat discovery for other instances instead of copying the first node’s path. Listener diagnostics should be mapped to the appropriate local or SCAN listener entity. Clusterware’s documented ADR home is <GRID_ORACLE_BASE>/diag/crs/<hostname>/crs, with the text alert in trace/alert.log; discover the actual Grid base and hostname on the VM. Original database walkthrough, Clusterware diagnostics
Grant mgmt_agent access to database and listener logs
The standalone Management Agent runs as mgmt_agent. That account needs read access to the log files and read/execute access through every directory in each log path. Oracle recommends filesystem ACLs as the first method to grant this access. Review existing ACLs before changing them, verify that the acl package is present, and add permissions without replacing existing entries. The command is setfacl; the similar spelling setfactl is invalid. Grant read access to the agent user
The following database-alert example uses the observed /u02/app/oracle/diag/rdbms/oradbrac/ORADBRAC2/trace directory. Replace the database unique name, instance name, and path with the values discovered on the target database node. Open a root login shell:
sudo su -
At the root prompt, grant traversal on the parent directories, grant recursive access to the existing ADR contents, and set a default ACL on the trace directory for future files:
rpm -q acl
getfacl -p /u02/app/oracle/diag
setfacl -m u:mgmt_agent:rx /u02
setfacl -m u:mgmt_agent:rx /u02/app
setfacl -m u:mgmt_agent:rx /u02/app/oracle
setfacl -m u:mgmt_agent:rx /u02/app/oracle/diag
setfacl -R -m u:mgmt_agent:rx /u02/app/oracle/diag
setfacl -d -m u:mgmt_agent:rx \
  /u02/app/oracle/diag/rdbms/oradbrac/ORADBRAC2/trace
getfacl -p \
  /u02/app/oracle/diag/rdbms/oradbrac/ORADBRAC2/trace
exit
The following listener example is for host-vak332. Replace the hostname and retain only the listener directories that exist on the target node:
sudo su -
At the root prompt, run:
rpm -q acl
getfacl -p /u01/app/grid/diag
setfacl -m u:mgmt_agent:rx /u01
setfacl -m u:mgmt_agent:rx /u01/app
setfacl -m u:mgmt_agent:rx /u01/app/grid
setfacl -m u:mgmt_agent:rx /u01/app/grid/diag
setfacl -R -m u:mgmt_agent:rx /u01/app/grid/diag
setfacl -d -m u:mgmt_agent:rx \
  /u01/app/grid/diag/tnslsnr/host-vak332/listener/trace
setfacl -d -m u:mgmt_agent:rx \
  /u01/app/grid/diag/tnslsnr/host-vak332/listener_scan1/trace
setfacl -d -m u:mgmt_agent:rx \
  /u01/app/grid/diag/tnslsnr/host-vak332/listener_scan2/trace
setfacl -d -m u:mgmt_agent:rx \
  /u01/app/grid/diag/tnslsnr/host-vak332/listener_scan3/trace
setfacl -d -m u:mgmt_agent:rx \
  /u01/app/grid/diag/tnslsnr/host-vak332/asmnet1lsnr_asm/trace
getfacl -p \
  /u01/app/grid/diag/tnslsnr/host-vak332/listener/trace
exit
Validate the effective permissions as the agent account before associating a source. The loop below checks read and traversal access to the example directories without displaying log contents:
for log_dir in \
  /u02/app/oracle/diag/rdbms/oradbrac/ORADBRAC2/trace \
  /u01/app/grid/diag/tnslsnr/host-vak332/listener/trace \
  /u01/app/grid/diag/tnslsnr/host-vak332/listener_scan1/trace \
  /u01/app/grid/diag/tnslsnr/host-vak332/listener_scan2/trace \
  /u01/app/grid/diag/tnslsnr/host-vak332/listener_scan3/trace \
  /u01/app/grid/diag/tnslsnr/host-vak332/asmnet1lsnr_asm/trace
do
  sudo -u mgmt_agent test -r "$log_dir"
  sudo -u mgmt_agent test -x "$log_dir"
done
After confirming the actual filenames, read one line from a representative database alert log and listener log as mgmt_agent. Successful output proves file-level read access without relying on root privileges:
database_alert_log=/u02/app/oracle/diag/rdbms/oradbrac/ORADBRAC2/trace/alert_ORADBRAC2.log
listener_log=/u01/app/grid/diag/tnslsnr/host-vak332/listener/trace/listener.log
sudo -u mgmt_agent tail -n 1 "$database_alert_log"
sudo -u mgmt_agent tail -n 1 "$listener_log"
Repeat the ACL and validation steps on every database node using that node’s discovered paths. Recheck access after database or Grid homes change and after log rotation. The default ACL helps future files inherit access, while the recursive ACL covers files and directories that already exist.
Create the ORADBRAC1 Oracle Database Instance entity
Create a separate entity for each database instance so that the Oracle-defined alert-log source can resolve the correct paths and use the Management Agent on the node that owns those files. This example creates ORADBRAC1 on host-vak331; the earlier ORADBRAC2 ACL path is a separate node-specific example.
- Open Observability & Management → Log Analytics → Administration → Entities, select the entity compartment, and click Create.
- Enter
ORADBRAC1for Name and select Oracle Database Instance for Entity Type. - Select the Management Agent compartment and
odb-aws-host-vak331as the Management Agent. - Enter the values discovered on that database node. The captured configuration uses the following properties:
| Entity property | Example value |
|---|---|
DIAGNOSTIC_DEST |
/u02/app/oracle/diag |
adr_home |
/u02/app/oracle/diag |
host_name |
host-vak331 |
oracle_home |
/u02/app/oracle/product/19.0.0.0/dbhome_2 |
port |
1521 |
- Click Save Changes, reopen the entity, and confirm that its type, agent, and properties match the target instance. Oracle-defined file sources use entity properties in their include patterns, so missing or incorrect property values can prevent source association or file matching. Create the database entity, entity properties in source patterns
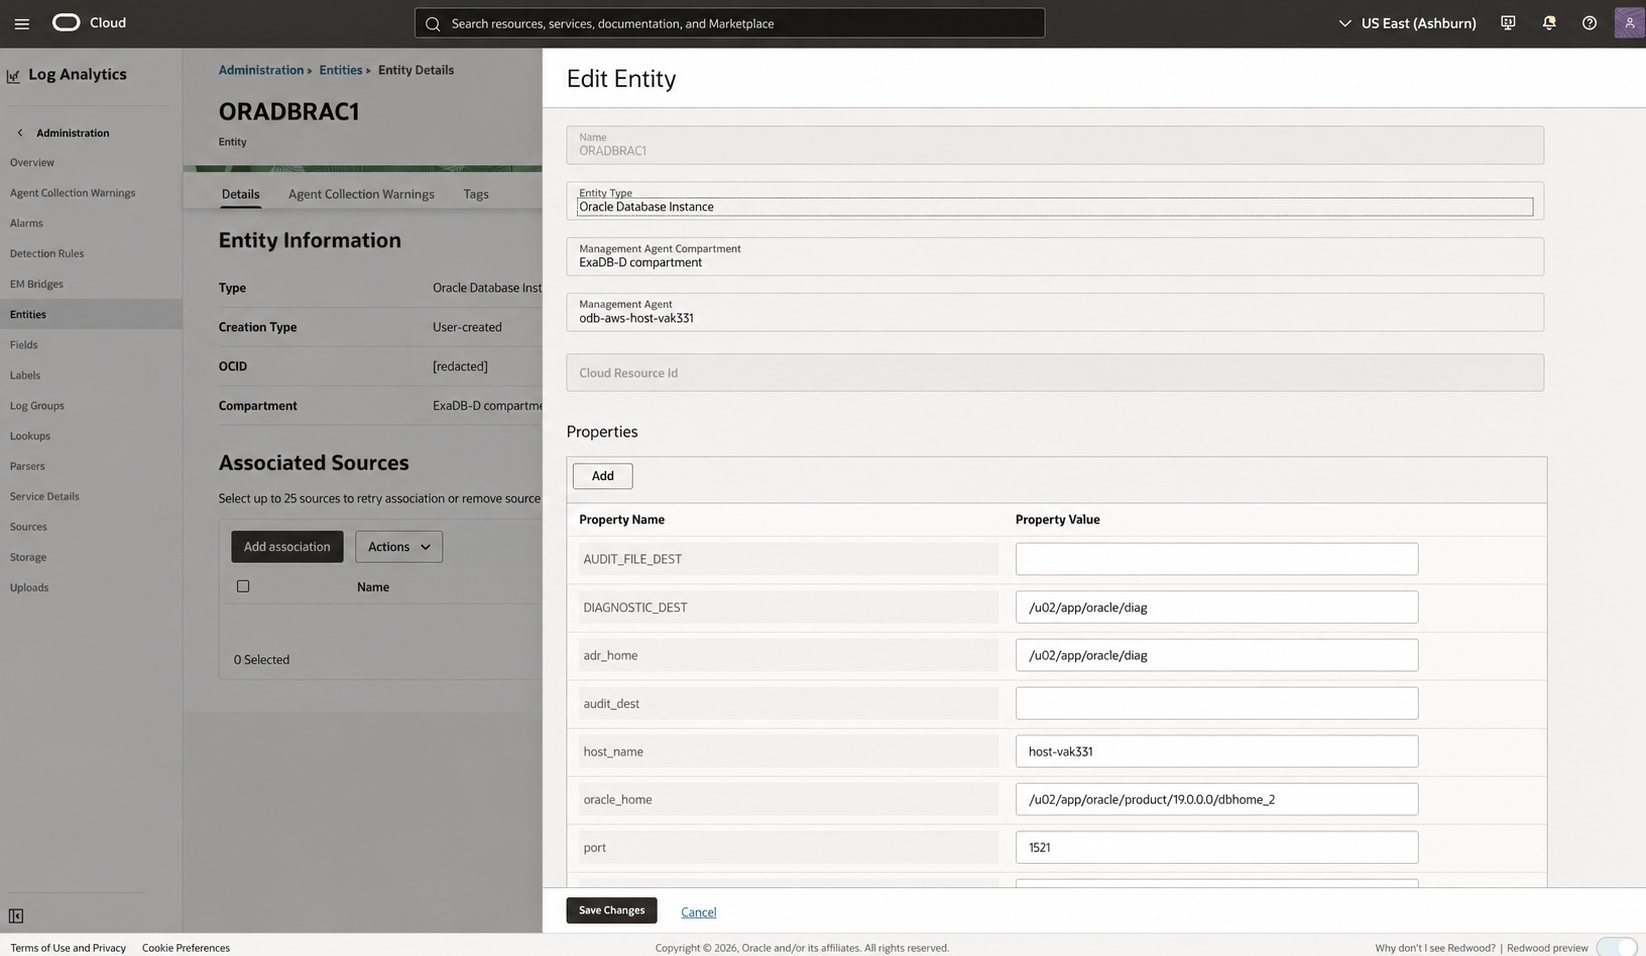
Figure 7. Saved ORADBRAC1 entity used for Oracle Database alert-log collection on host-vak331. The entity type is Oracle Database Instance, the associated agent is odb-aws-host-vak331, and the node-specific diagnostic properties are populated. The compartment identifier and entity OCID were replaced for publication.
Create the ORADBRAC2 Oracle Database Instance entity
Repeat the entity creation for the second database instance, using the Management Agent and Oracle home on host-vak332:
| Entity setting | Example value |
|---|---|
| Name | ORADBRAC2 |
| Entity Type | Oracle Database Instance |
| Management Agent | odb-aws-host-vak332 |
DIAGNOSTIC_DEST |
/u02/app/oracle/diag |
adr_home |
/u02/app/oracle/diag |
host_name |
host-vak332 |
oracle_home |
/u02/app/oracle/product/19.0.0.0/dbhome_1 |
port |
1521 |
Review the values against the paths discovered on host-vak332, then click Create Entity. After creation, reopen ORADBRAC2 and confirm that the selected agent and properties were saved before associating a source.
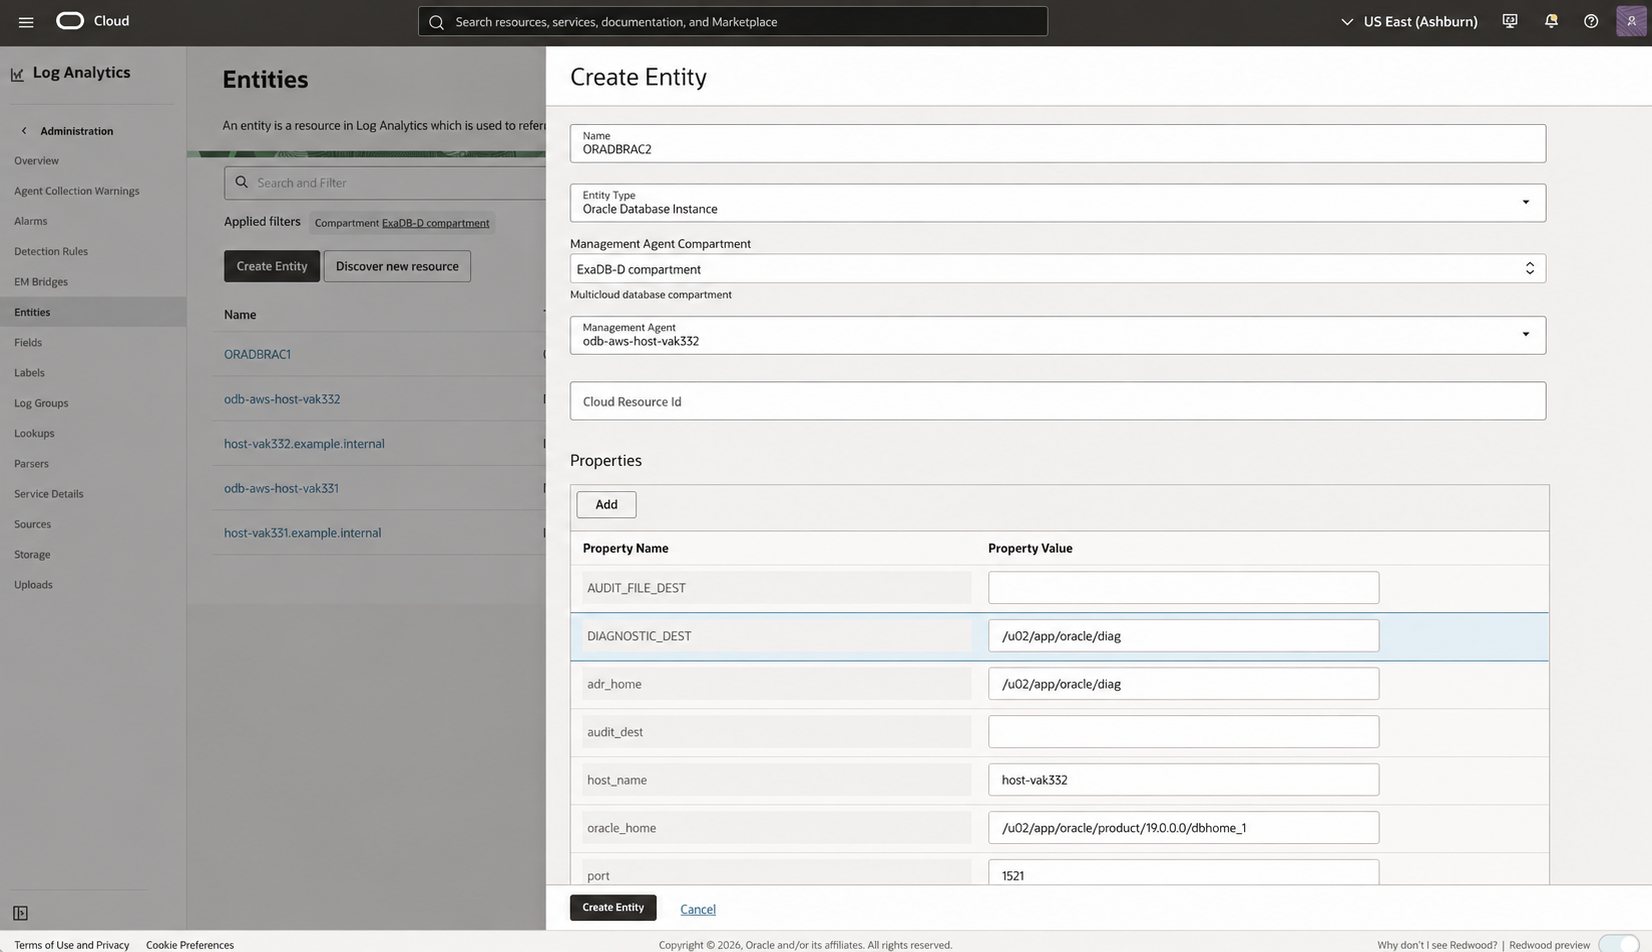
Figure 8. Creation of the ORADBRAC2 entity for alert-log collection on host-vak332. The entity uses odb-aws-host-vak332, the node’s /u02 diagnostic paths, dbhome_1, and port 1521. The compartment hierarchy and private DNS suffixes were replaced for publication.
Associate the database instances and log sources with Add Data
Use the Add Data wizard to create the source-entity associations for both RAC instances in one workflow. Oracle documents this wizard as the continuous-collection path for selecting entities, selecting sources, assigning a log group, and validating the association. Set up continuous log collection
- Open Observability & Management → Log Analytics → Administration → Overview, select the compartment that contains the database entities, and click Add Data.
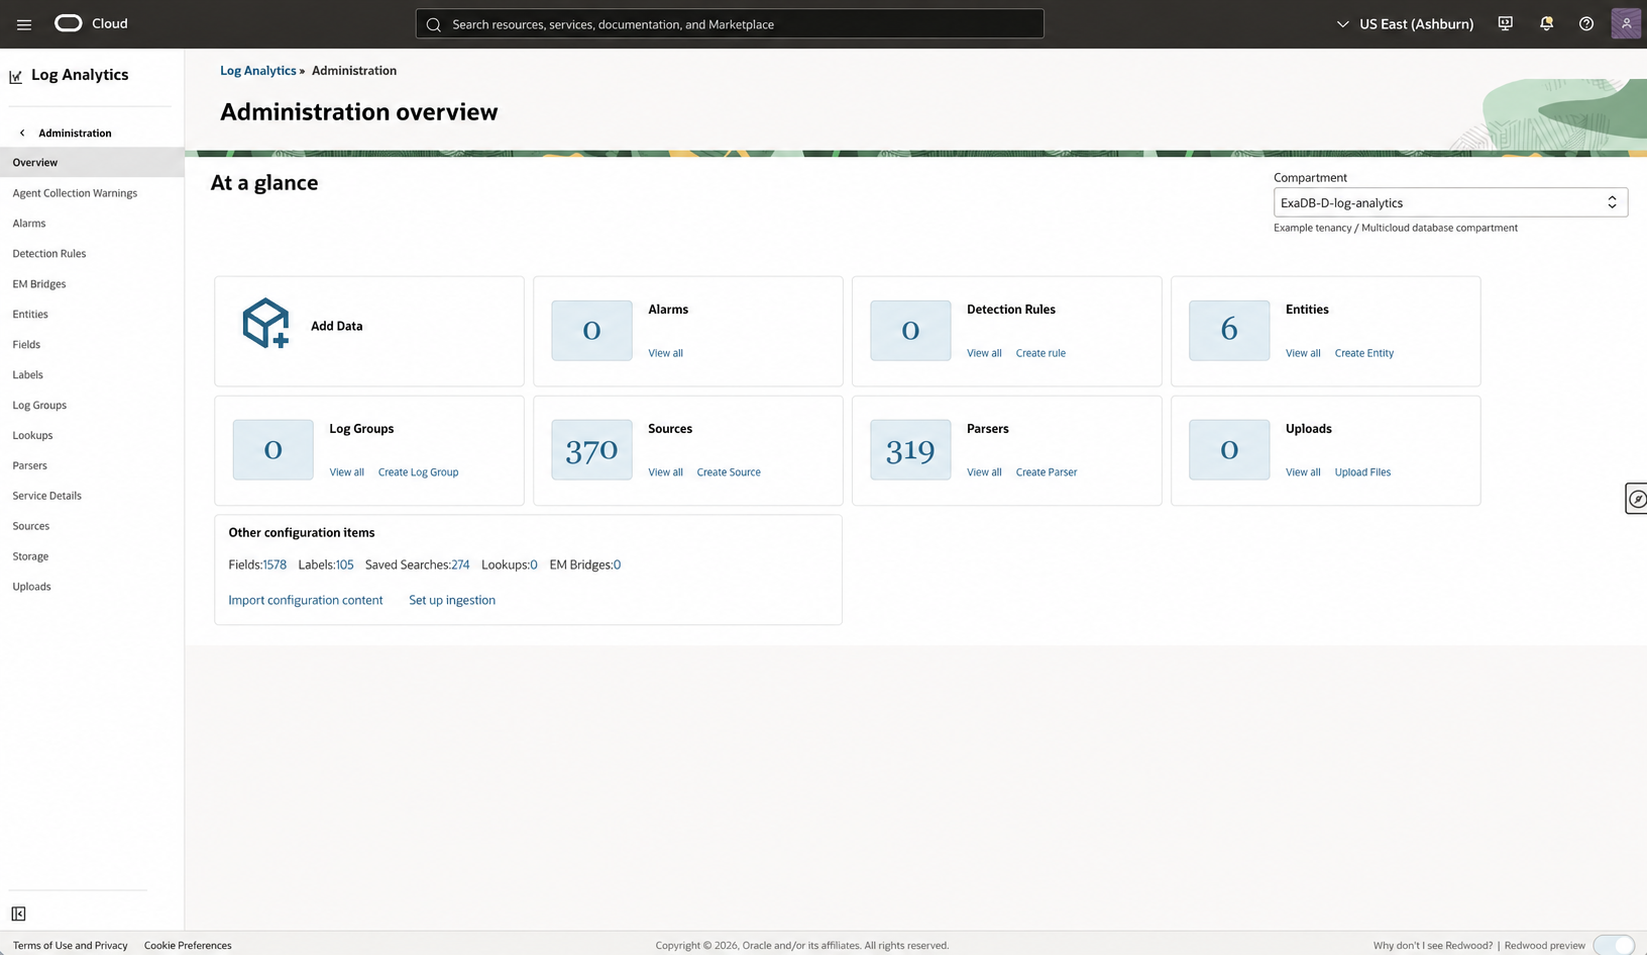
Figure 9. Start the source-association workflow from Add Data. The compartment name and hierarchy were replaced for publication.
- Expand Monitor with management agent and select Custom Selection.
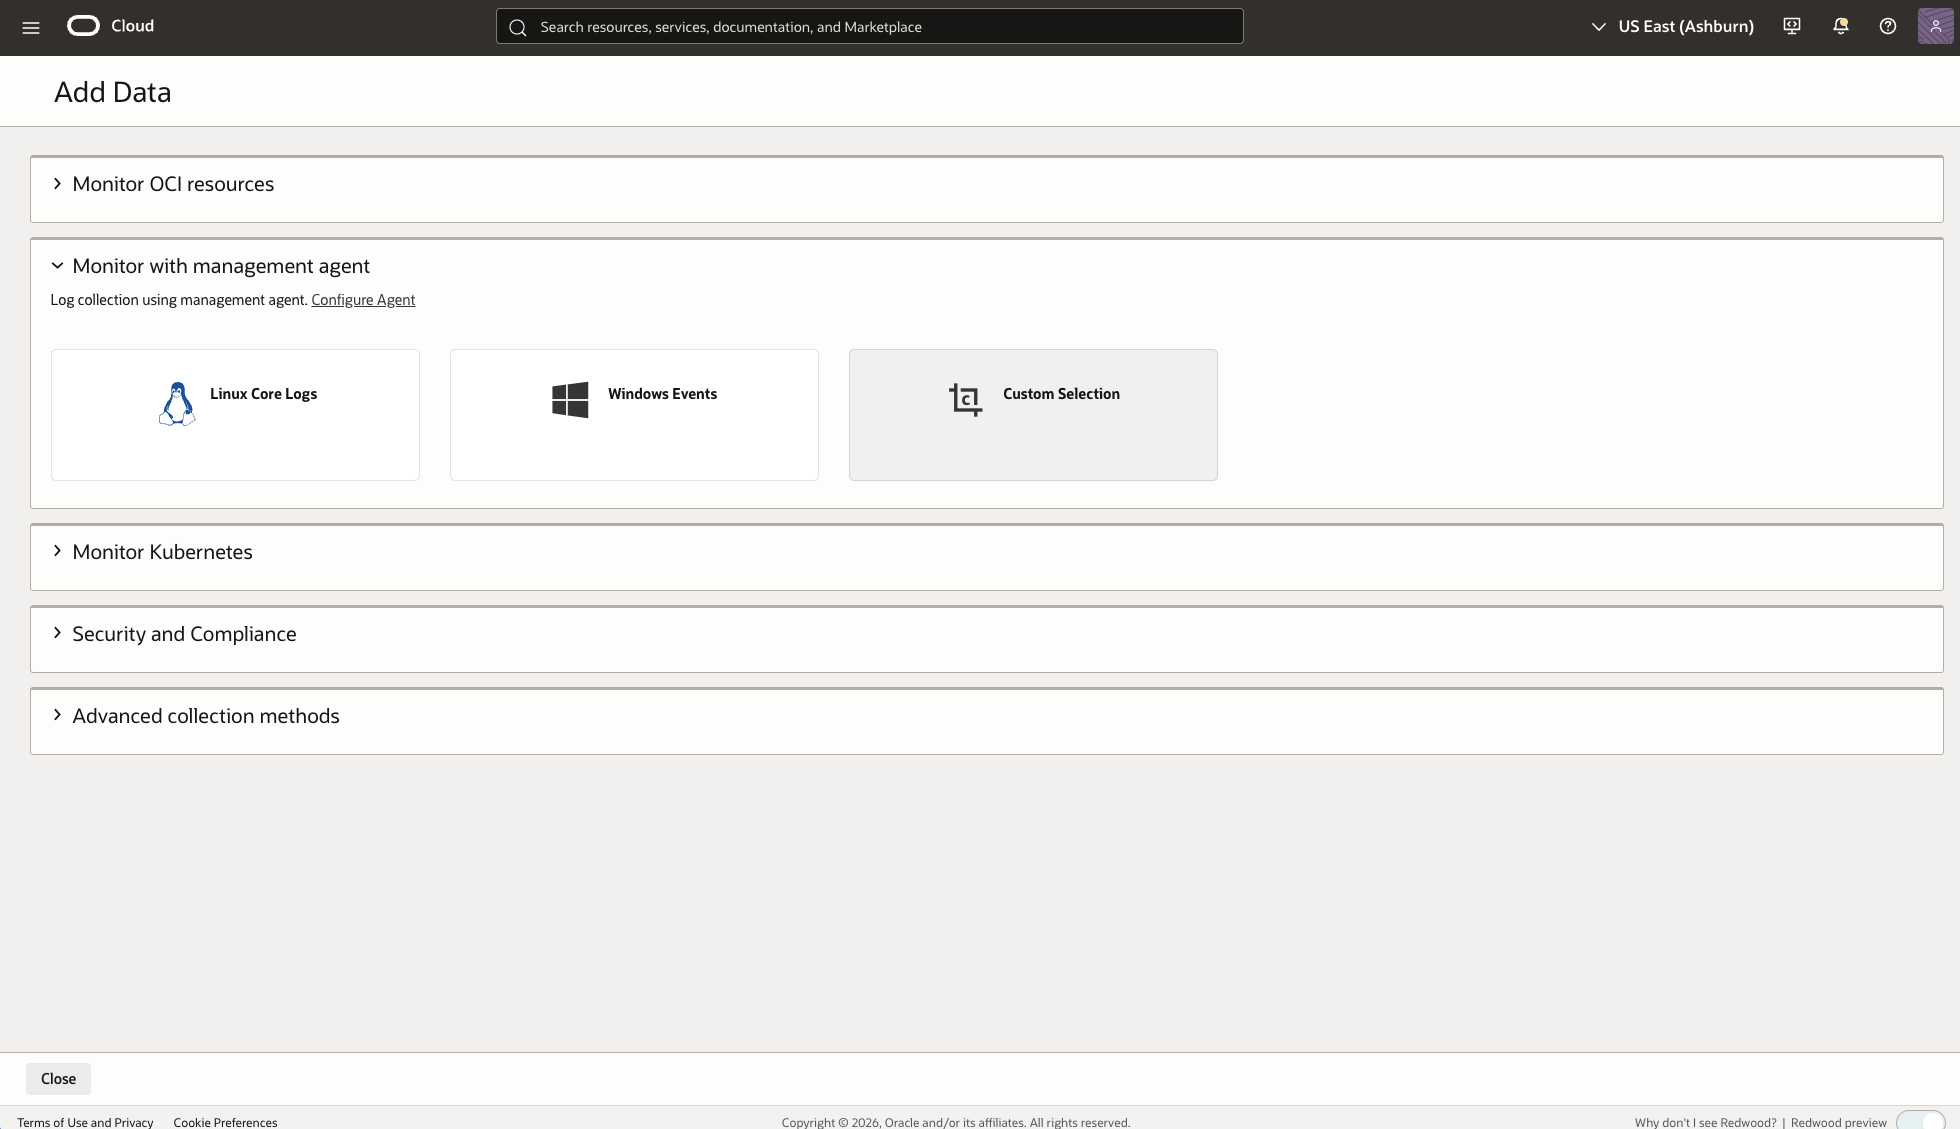
Figure 10. Custom Selection opens the Configure Agent-based Log Collection workflow for explicitly selected entities and sources.
- On Select Entities, filter to Oracle Database Instance when the fleet contains many entity types. Select
ORADBRAC1andORADBRAC2, confirm that each row resolves to its node-local Management Agent, and click Next.
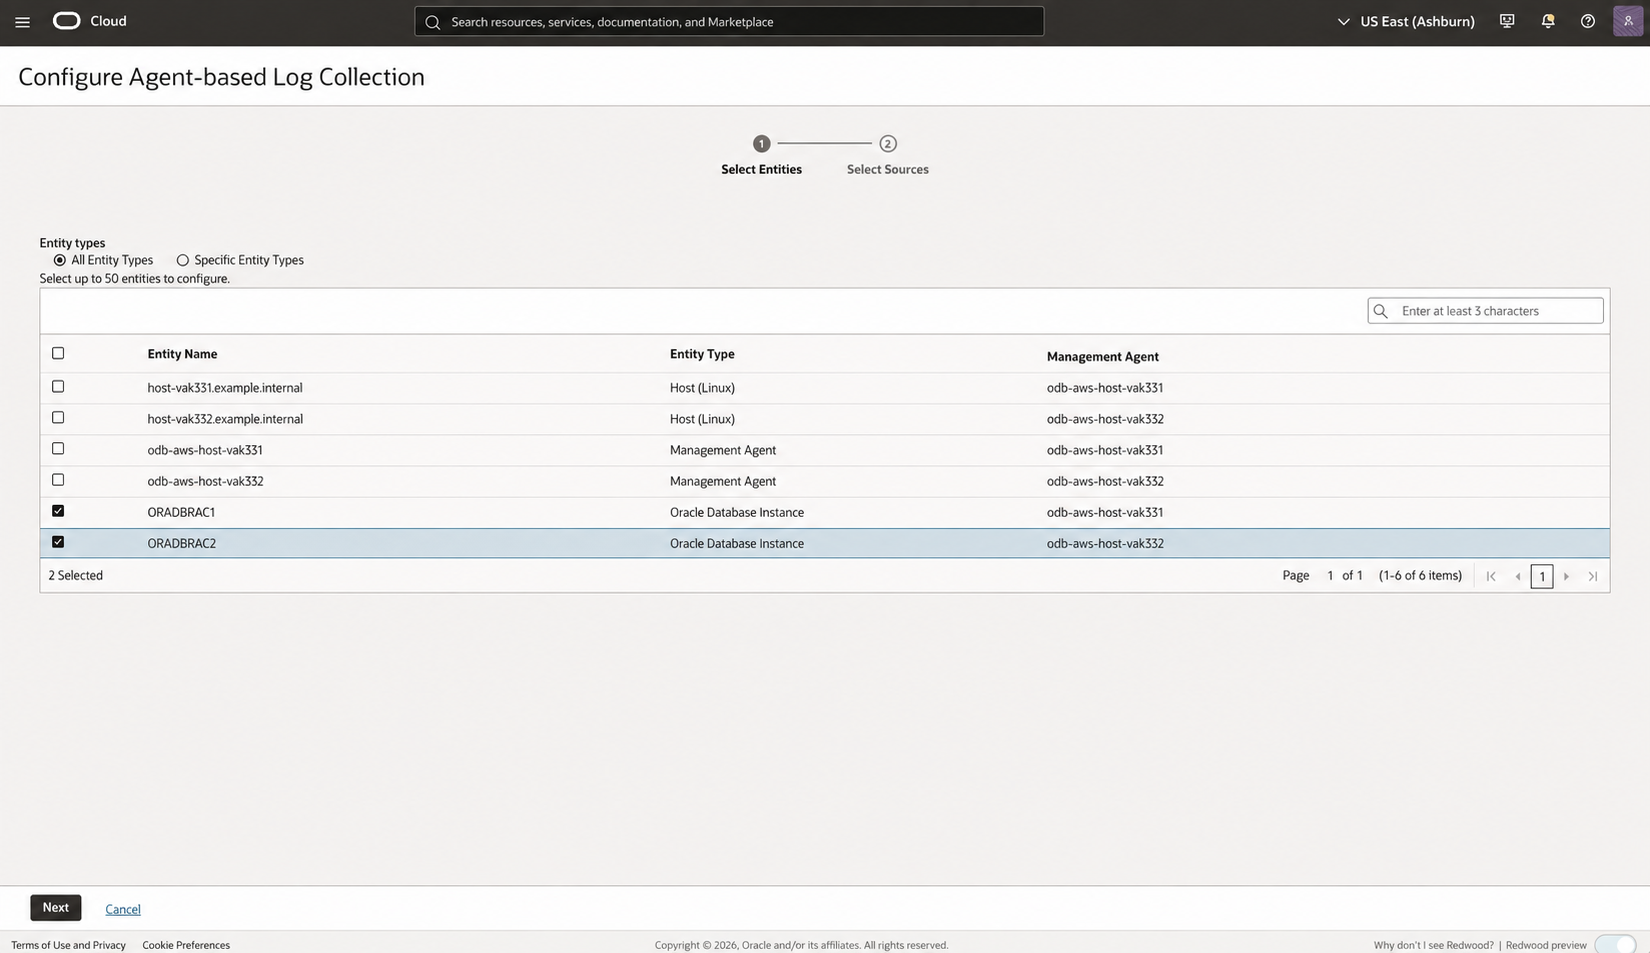
Figure 11. Both RAC instance entities are selected. Private DNS suffixes and Management Agent OCID fragments were replaced with example hostnames and the corresponding agent display names.
- On Select Sources, select the Oracle-defined Database Alert Logs file source. That source is the baseline for this walkthrough. The captured environment also selected Database Attention Logs and Database Incident Dump Files; add those only when the operating requirement and expected ingestion volume justify them.
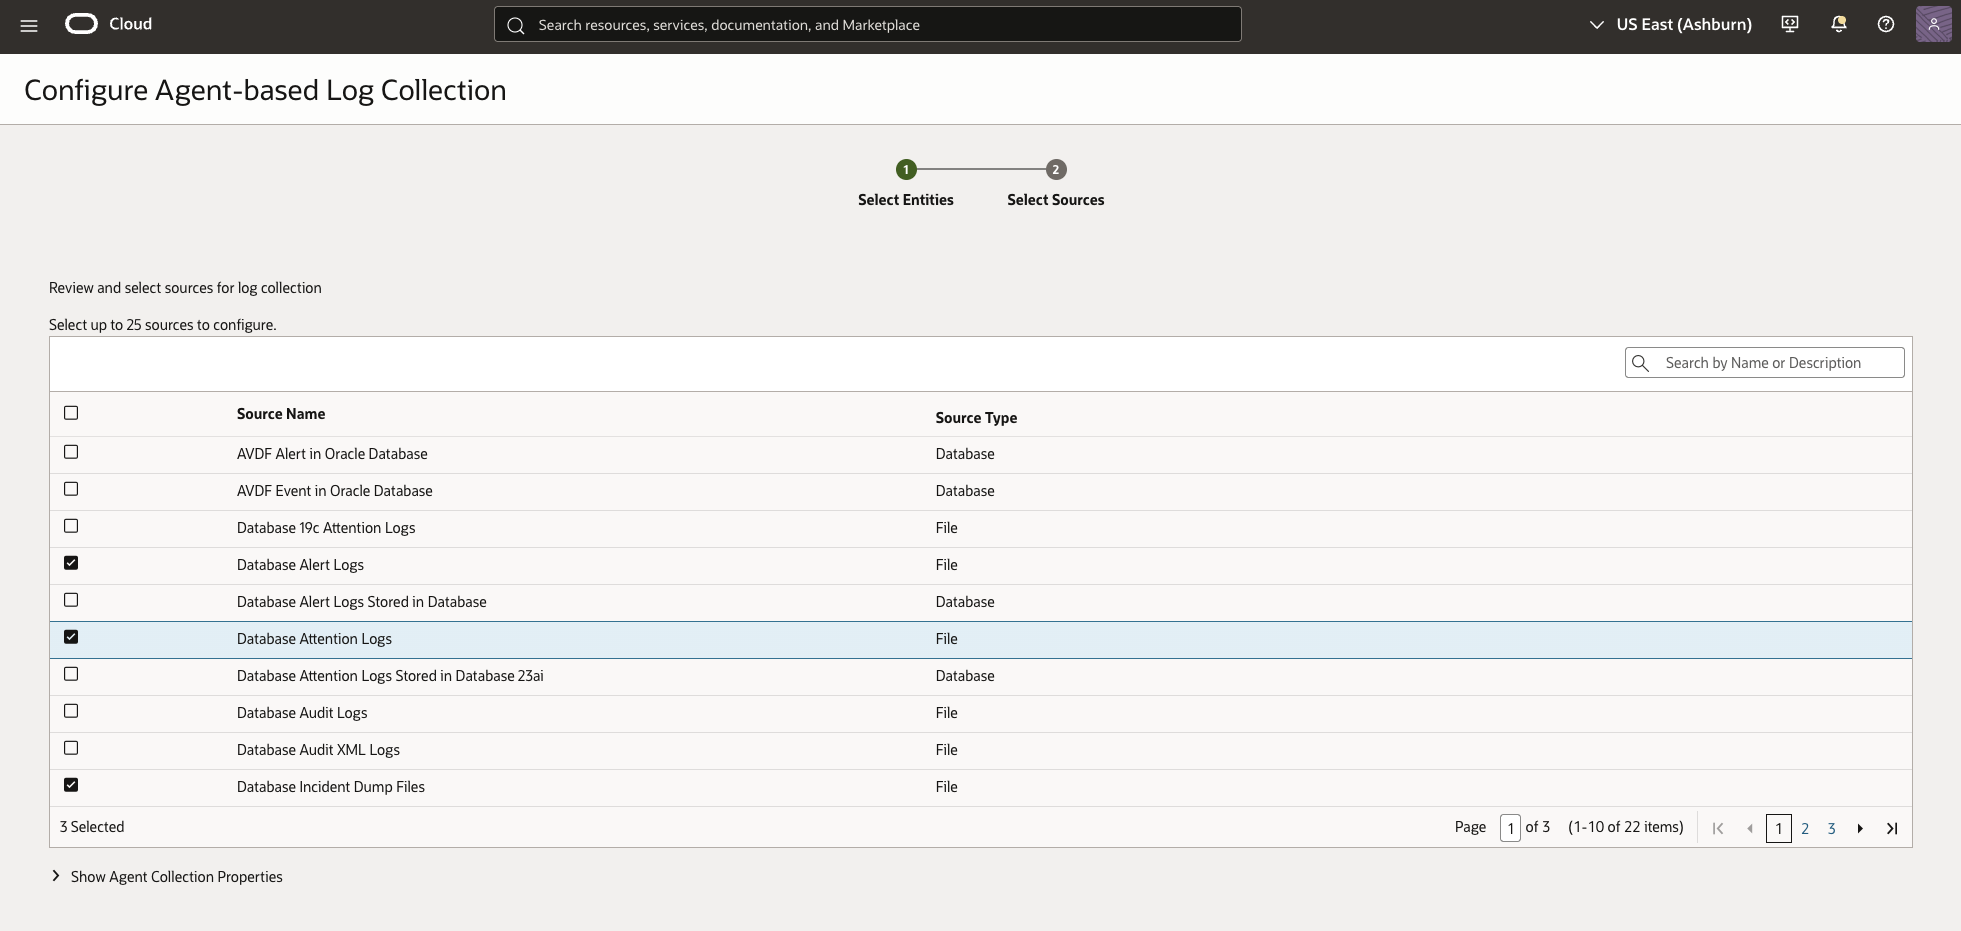
Figure 12. Database Alert Logs is the required source for this walkthrough. Database Attention Logs and Database Incident Dump Files are optional selections visible in the captured configuration.
- In Log Group Compartment, choose the intended destination compartment. Select an existing log group, or click Create New. This example creates
Multicloud_OracleDB_LogGroupwith the descriptionOracleDB@AWS.
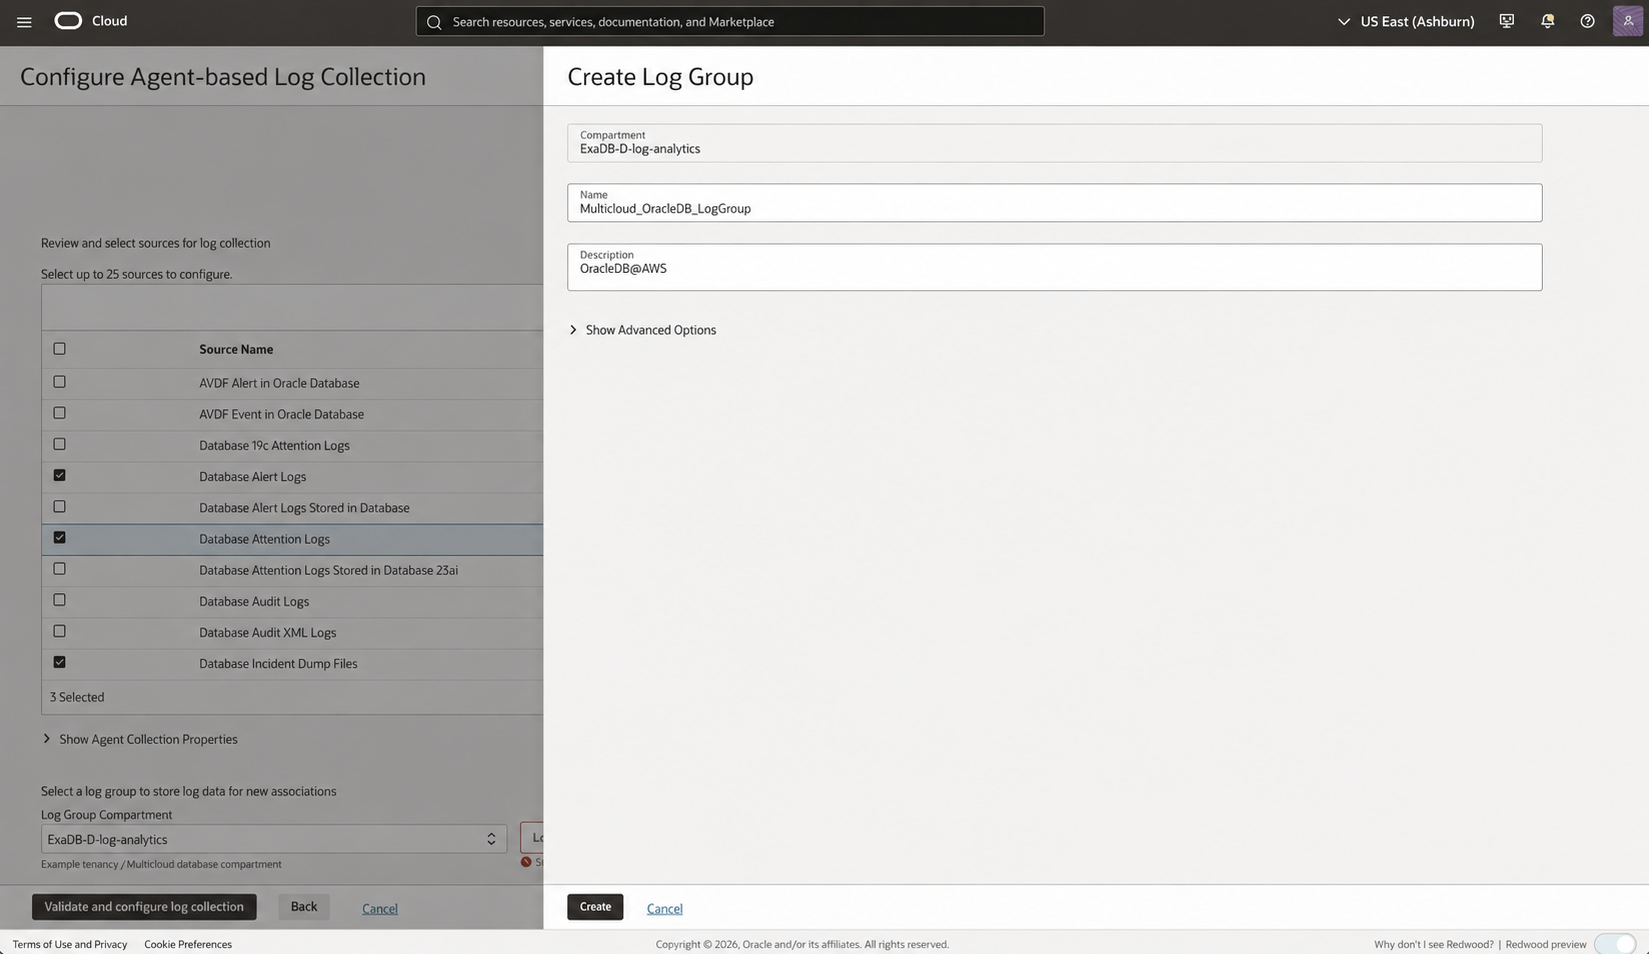
Figure 13. Creation of the Multicloud_OracleDB_LogGroup destination. The compartment identifier and hierarchy were replaced for publication.
- Confirm that the new log group is selected, review the entity and source choices, and click Validate and configure log collection.
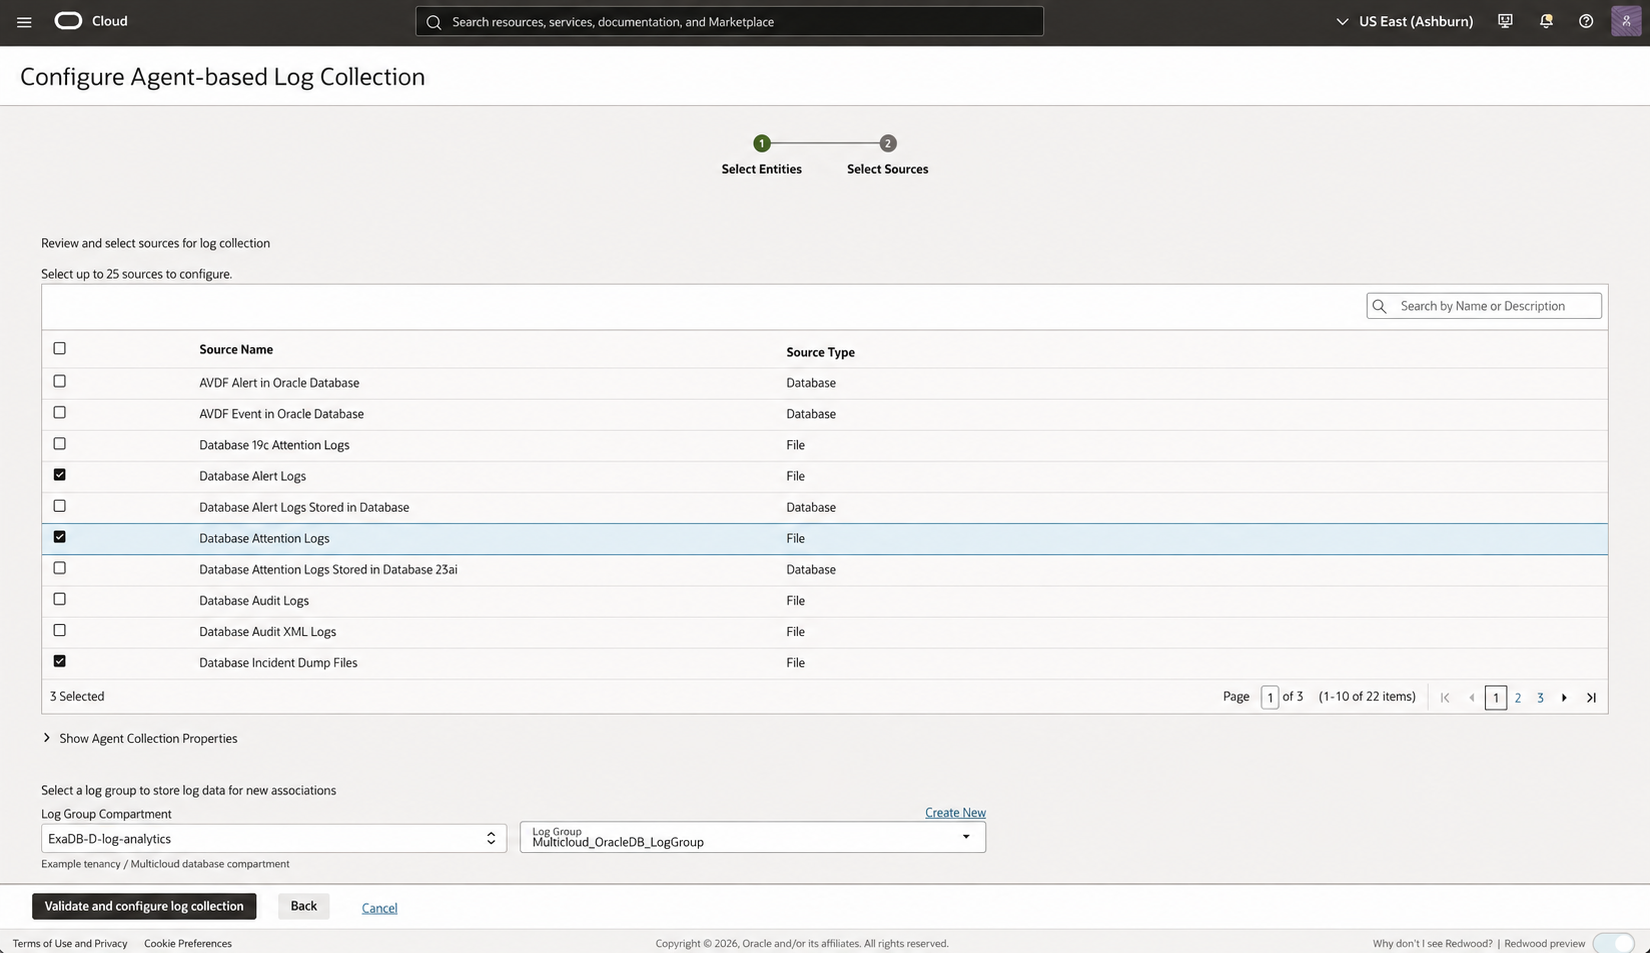
Figure 14. Pre-submit configuration with the destination log group selected. This screen does not prove that validation or association creation completed.
- Wait for the wizard to display its success confirmation. Open the activity status or source name and verify that the associations for both entities completed successfully. Then use Take me to Log Explorer or open Log Explorer separately. The supplied screenshot set stops at the pre-submit screen in Figure 14, so retain the actual confirmation or work-request result as deployment evidence before publication or rollout acceptance.
If validation fails, do not repeatedly submit the same configuration. Inspect Agent Collection Warnings, verify that the entity properties resolve to the intended alert-log paths, test file access as mgmt_agent, confirm that the Log Analytics plug-in is running, and verify the dynamic group and IAM policy below.
Verify the Management Agent dynamic group and upload policy
The Set Up Ingestion workflow can create some IAM resources automatically, but verify the result rather than assuming that it selected the intended scope. In Identity & Security → Dynamic Groups, open exadb-mgmtagent-dg and confirm that its matching rule covers the Management Agent resources in the Management Agent compartment:
ALL {resource.type='managementagent', resource.compartment.id='<management-agent-compartment-OCID>'}
Avoid the broader ALL {resource.type='managementagent'} rule unless every Management Agent in the tenancy is intentionally part of the collection identity. If the dynamic group belongs to an identity domain, include the domain name in policy subjects as Oracle documents. Continuous collection IAM
Oracle’s Allow continuous log collection using management agent dynamic groups template contains the metrics and upload permissions. This article’s policy collection also includes tenancy-level READ USERS, which appears in Oracle’s automatic agent-ingestion policy example. Select the compartment that contains the target Log Analytics resources for the compartment-scoped grants:
ALLOW DYNAMIC-GROUP <identity-domain>/exadb-mgmtagent-dg TO USE METRICS IN COMPARTMENT <log-analytics-compartment>
ALLOW DYNAMIC-GROUP <identity-domain>/exadb-mgmtagent-dg TO {LOG_ANALYTICS_LOG_GROUP_UPLOAD_LOGS} IN COMPARTMENT <log-analytics-compartment>
ALLOW DYNAMIC-GROUP <identity-domain>/exadb-mgmtagent-dg TO READ USERS IN TENANCY
Omit <identity-domain>/ when the subject syntax for the tenancy does not require it. The captured environment uses the valid but broader IN TENANCY form shown in Figure 15. Prefer the narrowest compartment scope that covers the metrics and upload operations; READ USERS remains tenancy-scoped. Oracle-defined policy templates, automatic-ingestion policy example
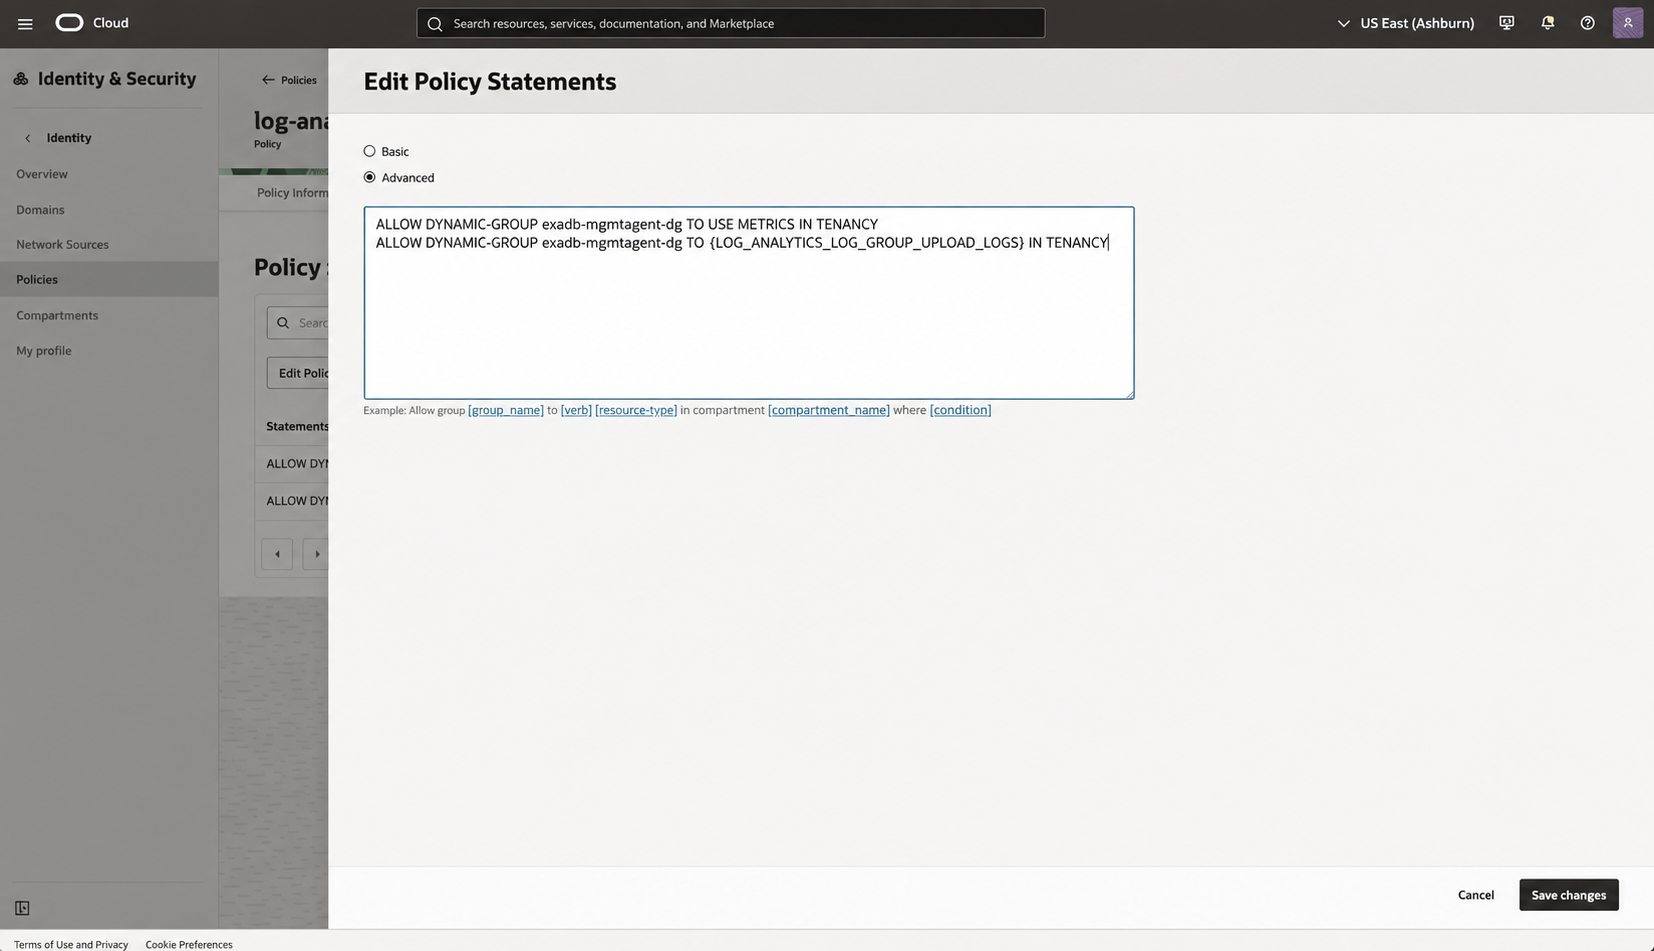
Figure 15. The captured tenancy-wide policy grants exadb-mgmtagent-dg permission to emit metrics and upload logs to Log Analytics log groups. The additional tenancy-scoped READ USERS statement is included in the policy collection shown in the text above. The tenancy OCID, cross-tenancy statements, and unrelated policy lines were removed from the publication copy.
Complete the association check in Log Analytics:
- Reopen
ORADBRAC1andORADBRAC2under Administration → Entities and confirm that Database Alert Logs appears under Associated Sources. - Inspect the source’s resolved include patterns and exclusions. Confirm that they resolve to the
ORADBRAC1alert-log location onhost-vak331and theORADBRAC2alert-log location onhost-vak332. - Inspect Agent Collection Warnings and correct entity-property, file-matching, IAM, or
mgmt_agentaccess problems before proceeding. - Open Log Explorer, select
Multicloud_OracleDB_LogGroupand Database Alert Logs, and verify a recent record from bothORADBRAC1andORADBRAC2, including each record’s timestamp, message, and extracted fields.
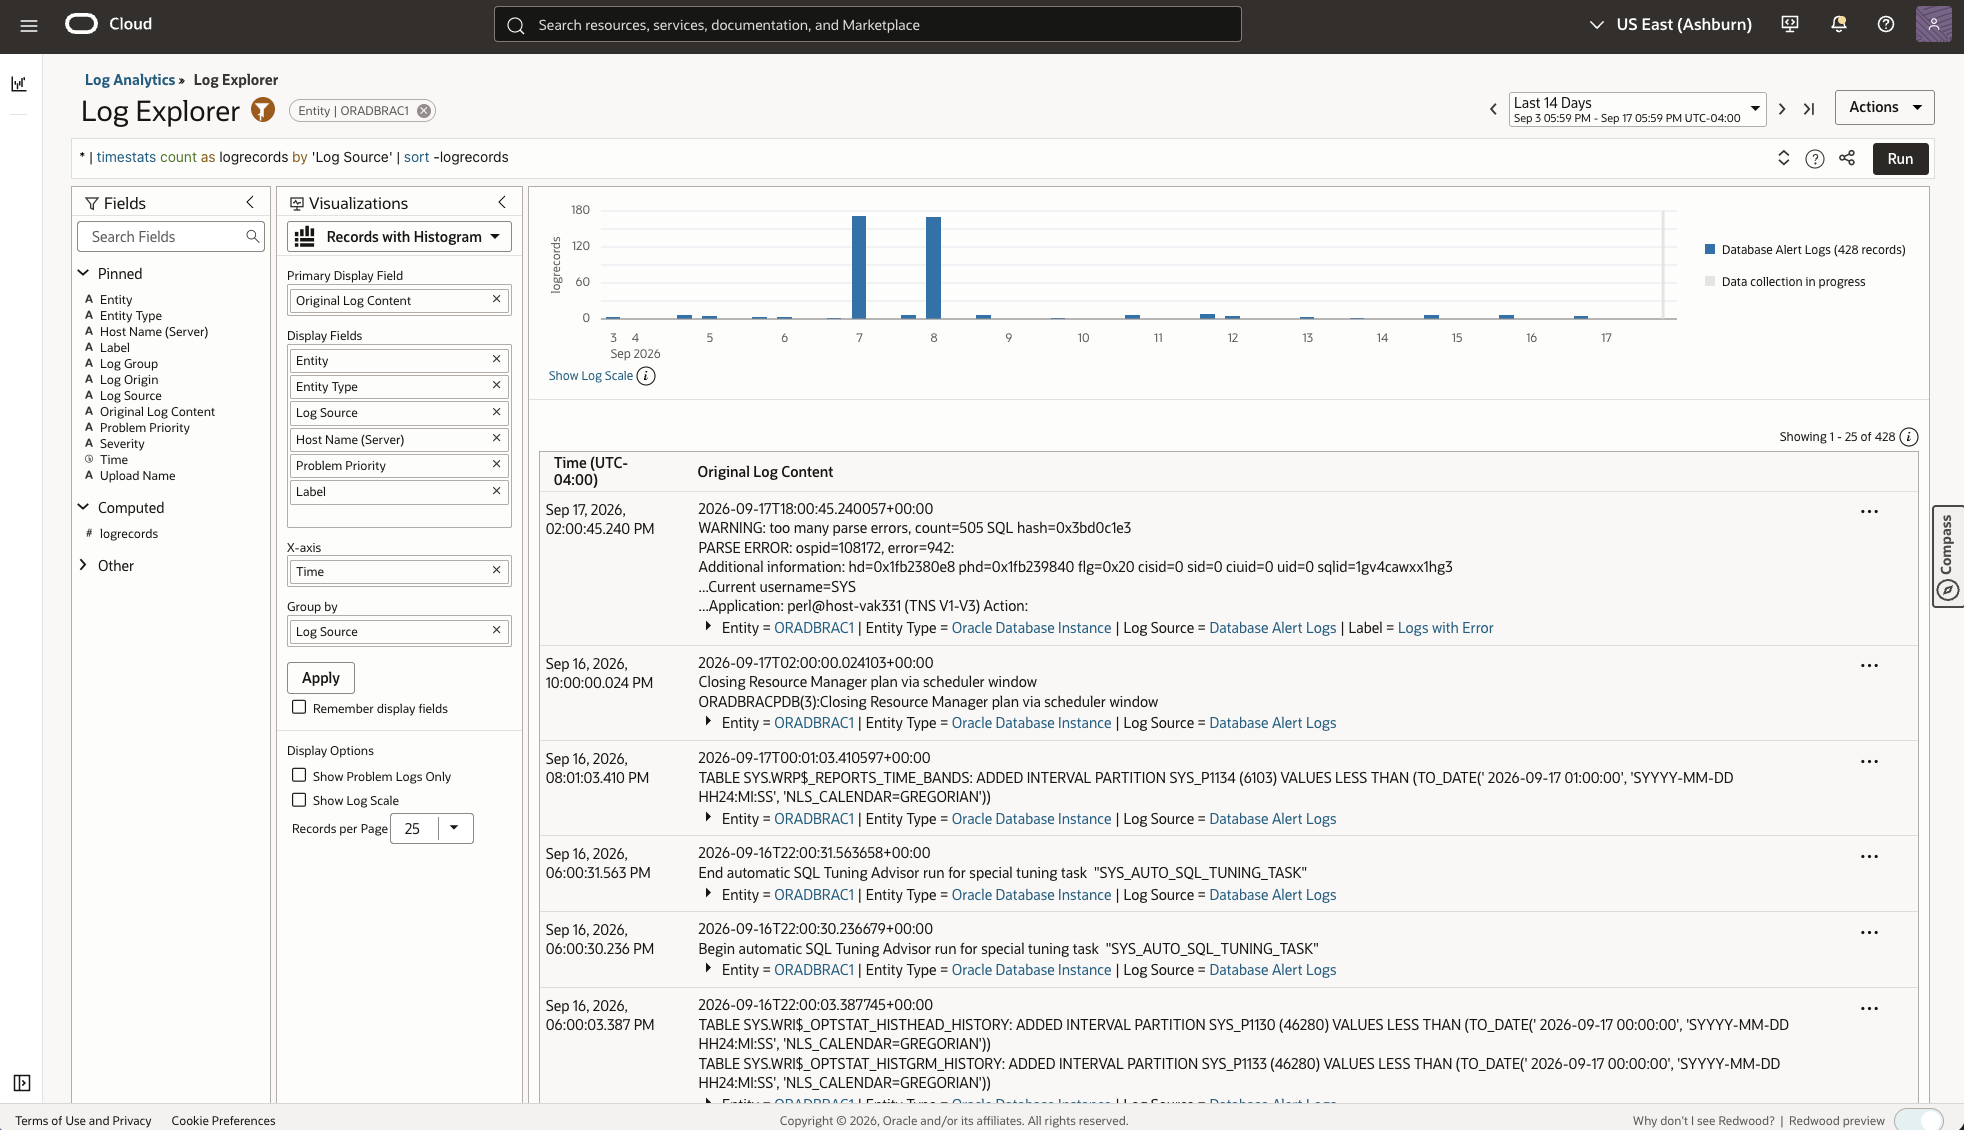
Figure 16. Entity-scoped collection evidence for ORADBRAC1. Log Explorer shows 428 Database Alert Logs records in the selected 14-day window, including parsed entity, entity type, source, priority, and label context. This validates records for this entity and time range; repeat the check for ORADBRAC2 and after log rotation.
The file collection workflow explains source patterns and entity associations. Begin with one alert representation; collecting both text and XML copies can duplicate an event in downstream counts. Extend to traces or incident dumps when their diagnostic value justifies the volume.
For rollout acceptance, capture the expected VM/entity/source list alongside agent status, collection warnings, and a recent record from each enabled source. A source with no recent records may simply be quiet. Compare collection status and file activity before concluding that it is either healthy or broken.
Optional extension: ExaWatcher diagnostics
ExaWatcher can add guest operating-system context to a database investigation, but its collection and parsing workflow is outside this article’s database and GI focus. For a worked implementation, see Jerry Russell’s Creating an Advanced Log Parser in Oracle Log Analytics for Exawatcher VMStat Output. It demonstrates parser functions, source data filters, Management Agent association, on-demand testing, and visualizations for ExaWatcher VMStat records.
Before applying that pattern, validate the ExaWatcher file location, agent permissions, timestamp handling, rotation behavior, and VMStat semantics on the target guest image. Oracle’s ExaWatcher documentation provides the utility background and operational guidance.
Build fleet dashboards and investigation queries
Start with the Oracle Database Alert dashboard, which includes views of database alert trends and errors. Duplicate the Oracle-defined dashboard to customize it, then add your guest-host and GI views. Configure common time and scope filters so the panels describe the same incident window. Database Alert dashboard, Dashboard customization
Open the Oracle Database Alert dashboard
Open Log Analytics → Dashboards, select the intended compartment, and search for oracle database. The Created by column identifies the Oracle-defined dashboards. Open Oracle Database Alert.
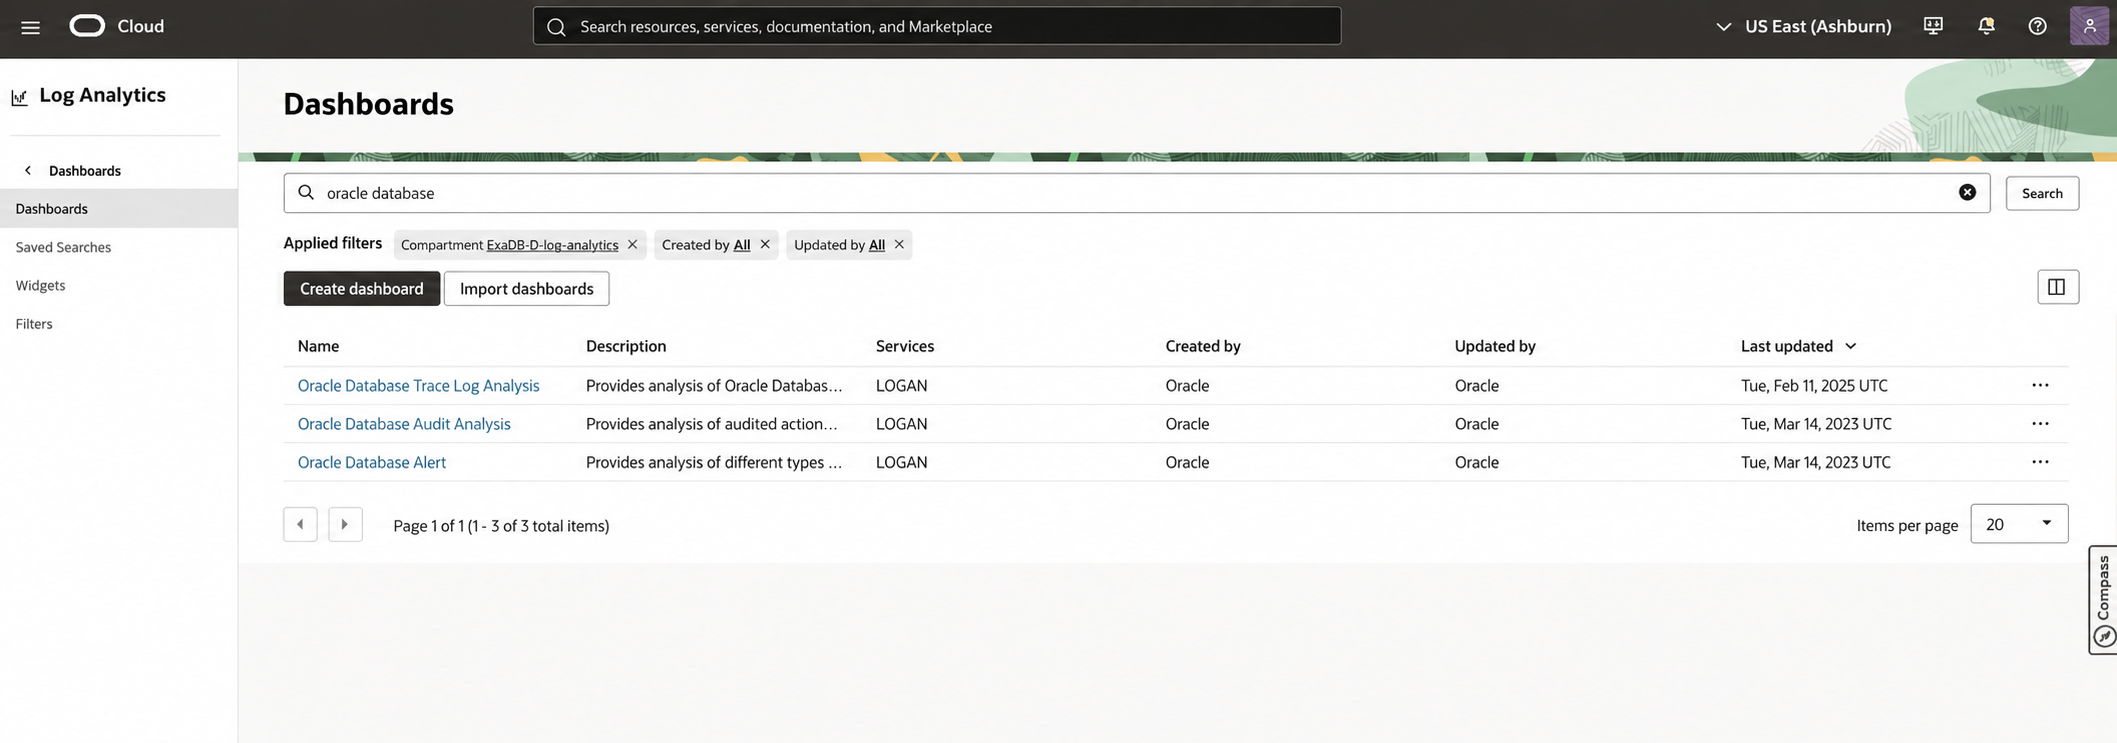
Figure 17. Oracle-defined database dashboards available in Log Analytics. The compartment name was replaced for publication.
Oracle-defined dashboards cannot be edited directly. Duplicate Oracle Database Alert before adding fleet-specific widgets, changing its filters, or replacing its saved searches. Apply the log-group compartment, region, entity compartment, database entities, and time range that belong to the ExaDB-D fleet.
Build the Oracle Database Alert Error Summary saved search
Open the Error Summary widget in Log Explorer or create a saved search using this query:
'Log Source' = 'Database Alert Logs'
| link 'Error ID', Entity
| lookup table = 'ORA Error Messages' select errmsg as 'Error Message'
  using 'Error ID' = errid
| stats unique('Problem Priority') as Severity
| eventstats ifnull(sum(Count), 0) as 'Total Errors',
  unique(Entity) as 'Database(s) with issues',
  ifnull(distinctcount(Entity), 0) as 'Number of database(s) with issues'
| fields target = ui -'Total Errors', -'Number of database(s) with issues'
The link command groups records by error ID and database entity. The lookup enriches matching error IDs with the ORA Error Messages table, while eventstats adds totals across the result. The final fields target = ui clause removes the two helper totals from the Link groups table without discarding the backend fields. If Error Message is blank, confirm that the lookup contains the parsed errid; keep the parsed Error ID and original records as the primary evidence.
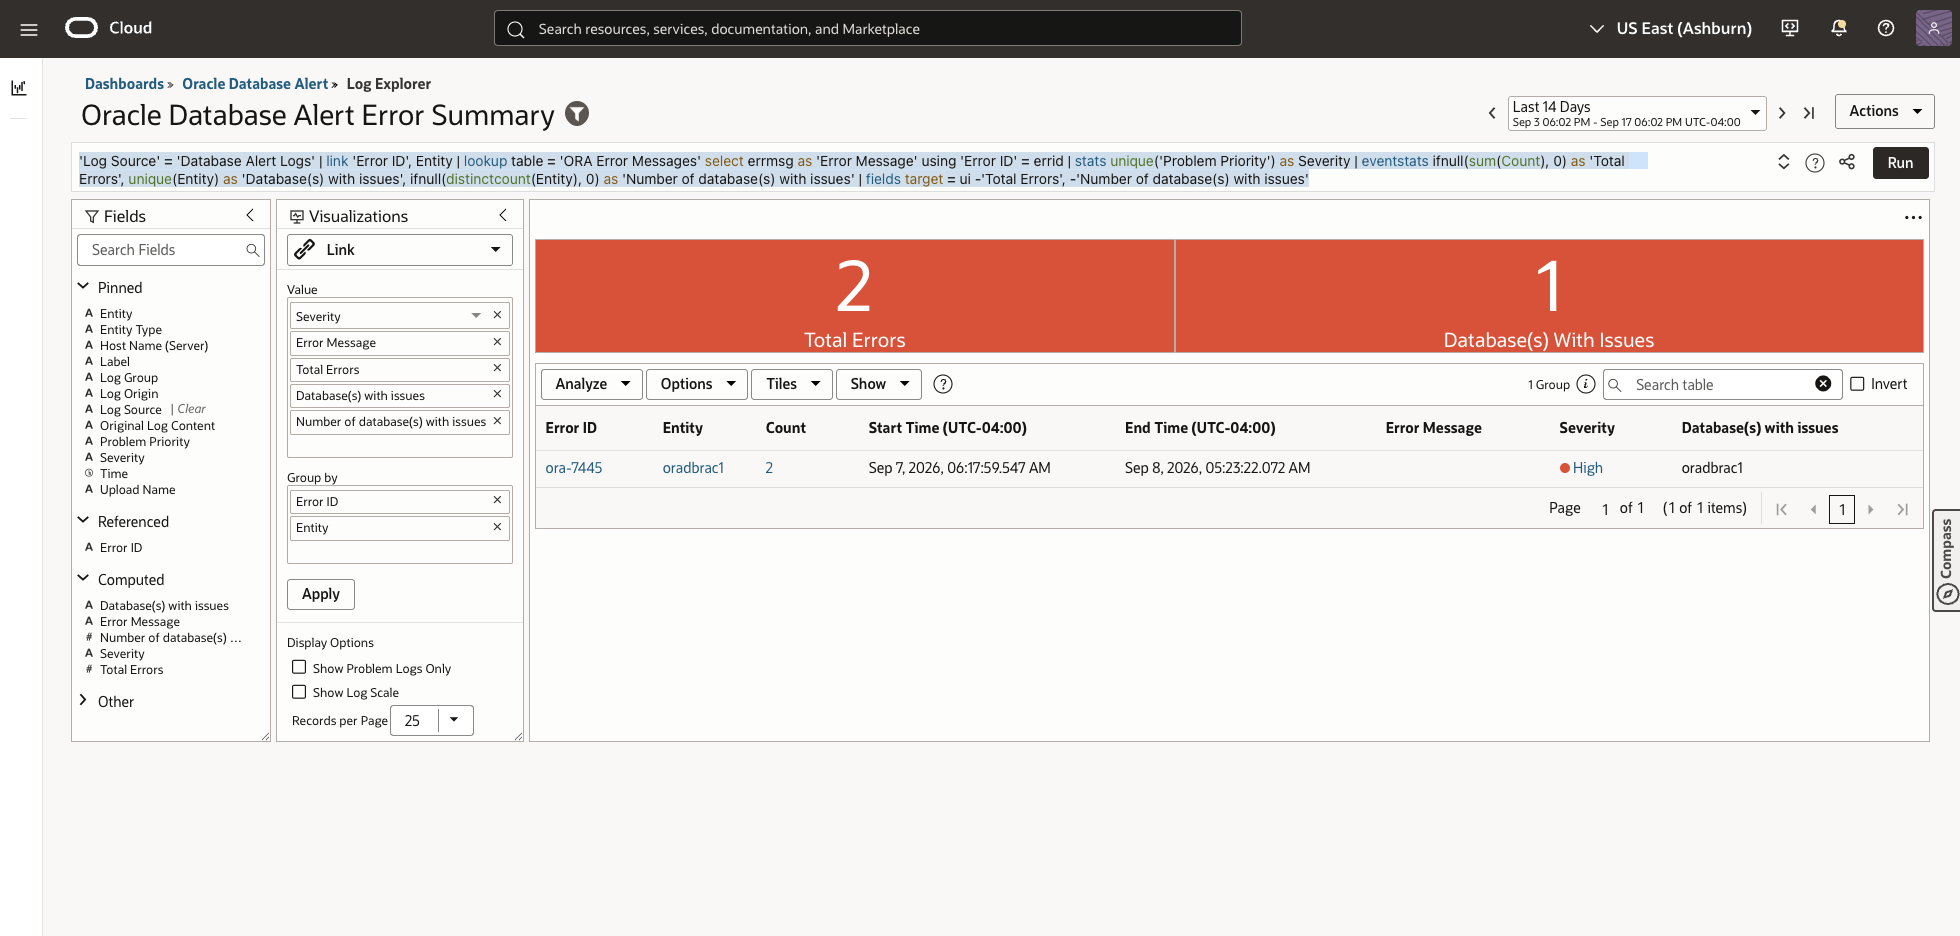
Figure 18. The saved search groups two ORA-7445 records for oradbrac1, marks the group High severity, and reports one database with issues in the selected 14-day window.
Save the search with a relative time range when the widget should stay current, and add it to the duplicated dashboard. A fixed time range preserves one investigation window instead. Oracle documents saved searches as reusable dashboard widgets and supports duplicating Oracle-defined searches before customization. Save and share log searches
Drill into the ORA-7445 records
In Figure 18, click the linked count 2 for the ORA-7445 row. Log Analytics opens the two records in the Link collection and narrows the time range to their interval.
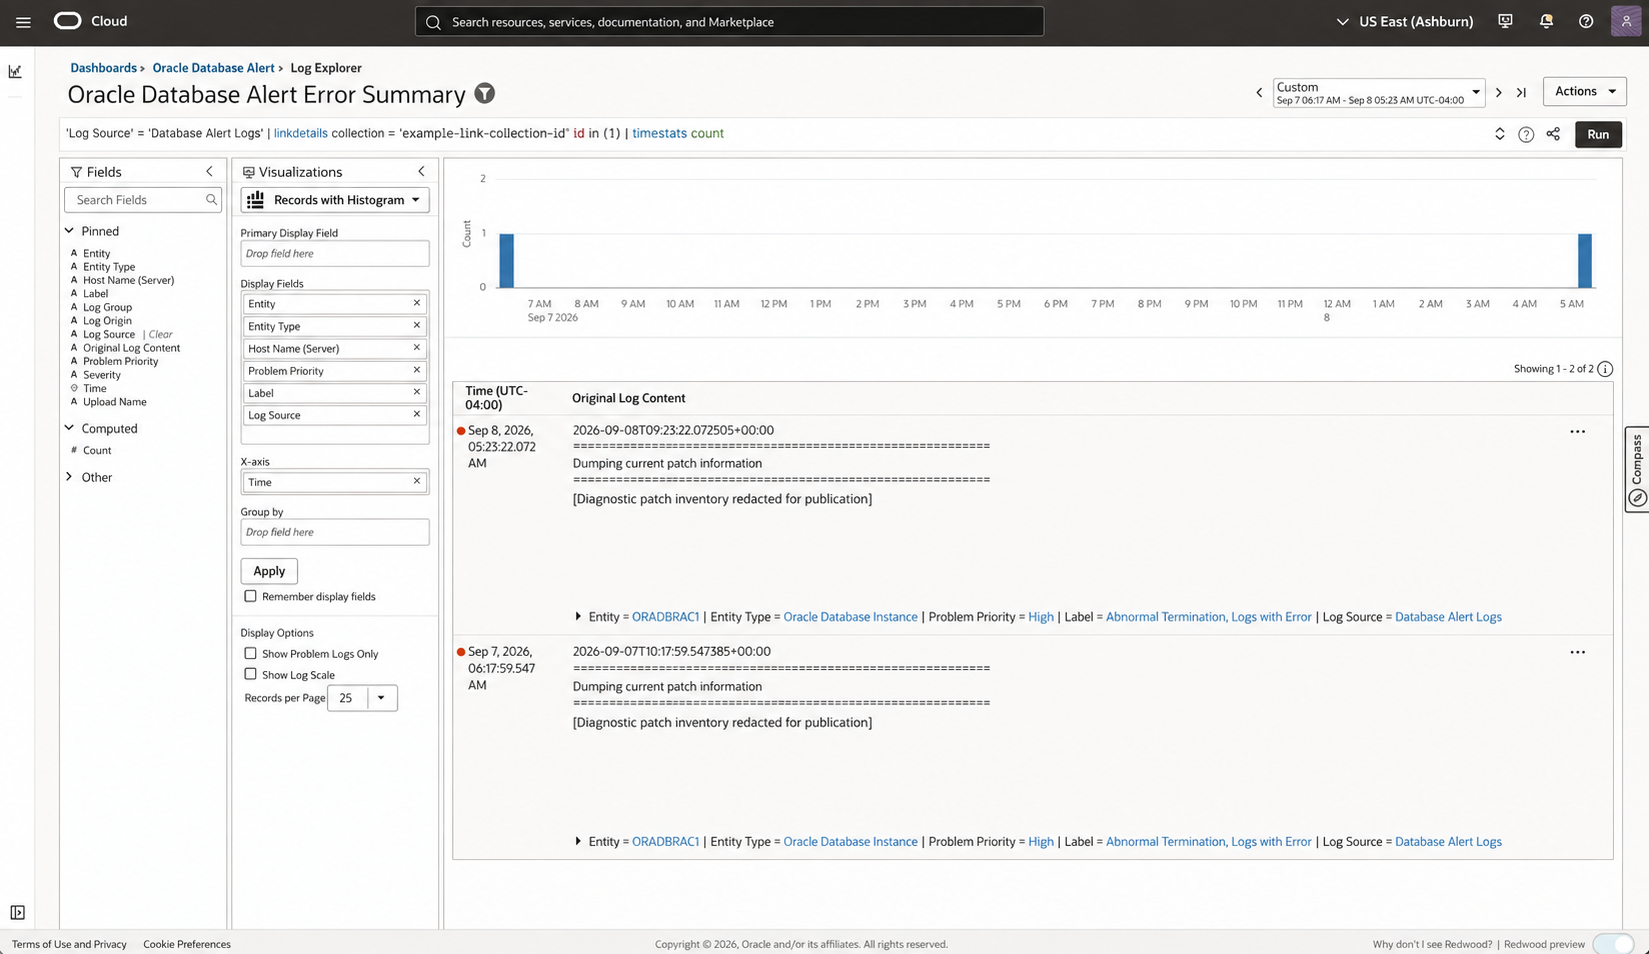
Figure 19. Record-level drilldown from the ORA-7445 group. The Link collection identifier and patch inventory were replaced for publication; the entity, source, severity, label, timestamps, and two-record sequence remain visible.
Use this drilldown to inspect the alert entry, trace-file or incident references, surrounding database messages, and records from GI, ASM, and listener sources in the same window. The two linked records establish temporal context; they do not by themselves identify the ORA-7445 root cause. Preserve the original alert and trace evidence for the database diagnostic or Oracle Support workflow.
Add AI-powered assistance with LoganAI
LoganAI is the generative AI capability in Log Analytics. It can summarize individual records, groups, clusters, and charts; explain complex results; and propose context-aware follow-up questions within the Log Analytics workflow. It uses OCI Generative AI in the tenancy. Oracle cautions that AI-generated responses can be incomplete or inaccurate, so validate every explanation against the original records before making an operational decision. Use LoganAI
To enable it for a region, open Administration → Service Details → Configure LoganAI settings. Select the OCI Generative AI region and compartment, choose the model behavior, review and accept the required model licenses, select the user license-acceptance policy, and configure the displayed IAM permissions. Run Test under Validate settings before clicking Update LoganAI settings. LoganAI availability is regional, the selected OCI Generative AI service can add usage charges, and logs can be sent from the Log Analytics region to the selected Generative AI region. Enable LoganAI
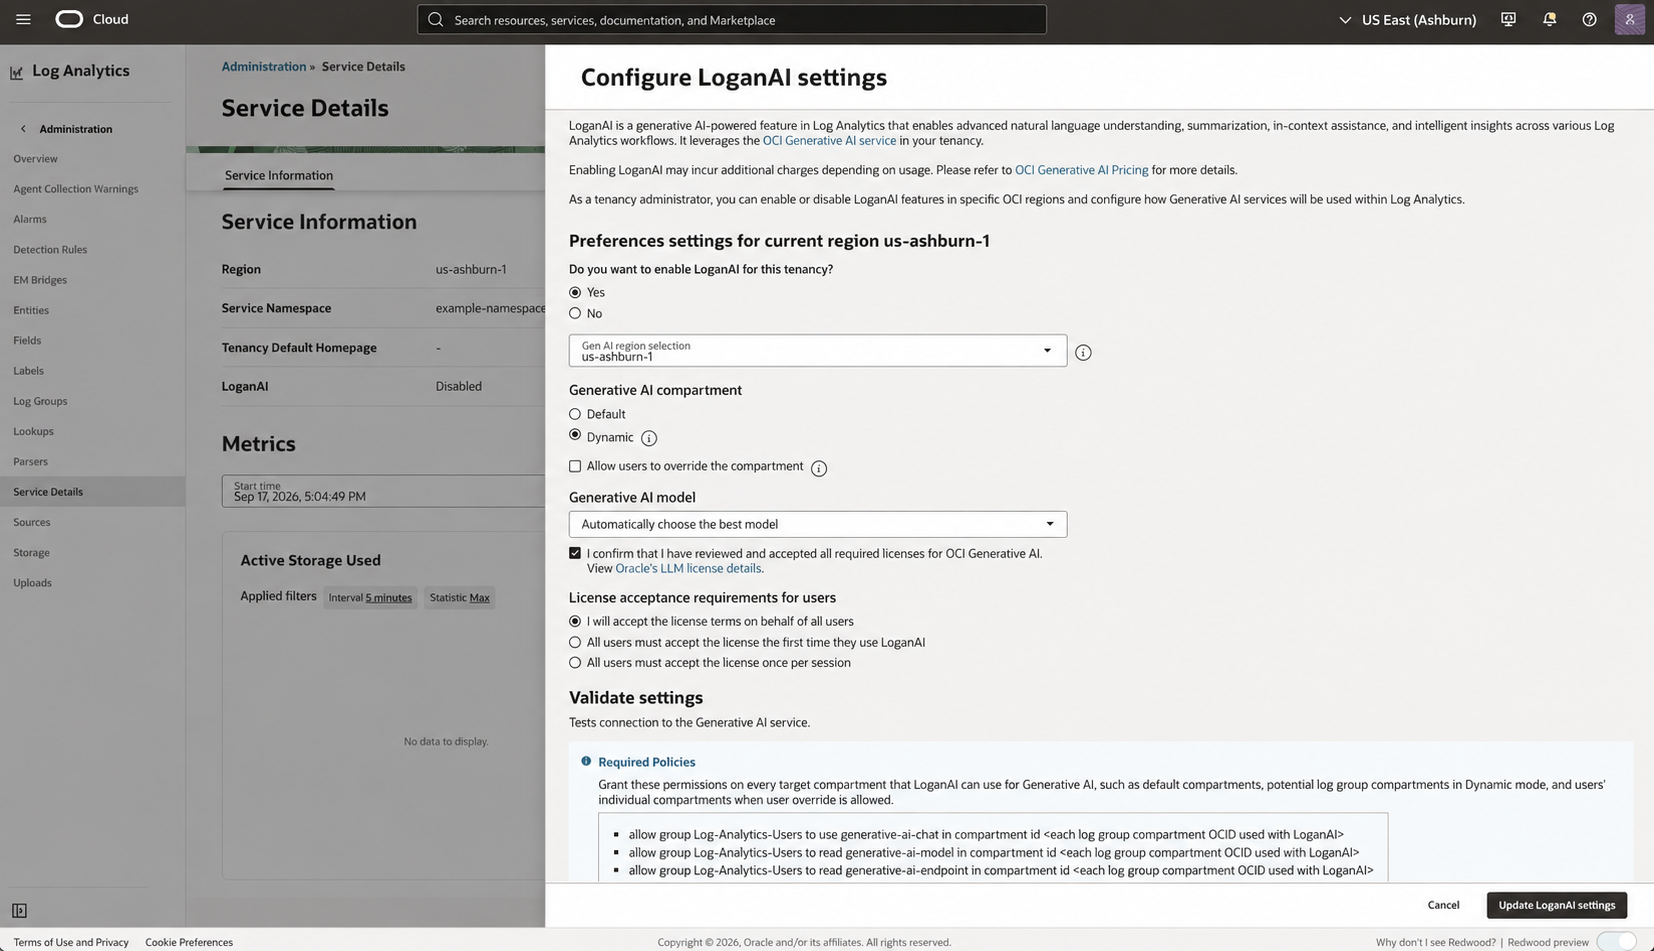
Figure 20. Pre-update LoganAI configuration. The service namespace was replaced for publication. The background status remains Disabled; this screen documents the intended settings and does not prove that validation or activation succeeded.
After activation, use Explain on the selected ORA-7445 group or its surrounding chart to request a concise summary and investigation questions. Check every claim against the records, database trace files, and corroborating sources before adding it to the incident timeline or RCA.
Use a consolidated database-alert view
The Oracle-defined dashboard brings the alert summary, new issues and outliers, log trends, ORA and TNS distributions, corrupt-block results, database distribution, severity, and error trends into one view. Set the time and scope filters before interpreting its totals.
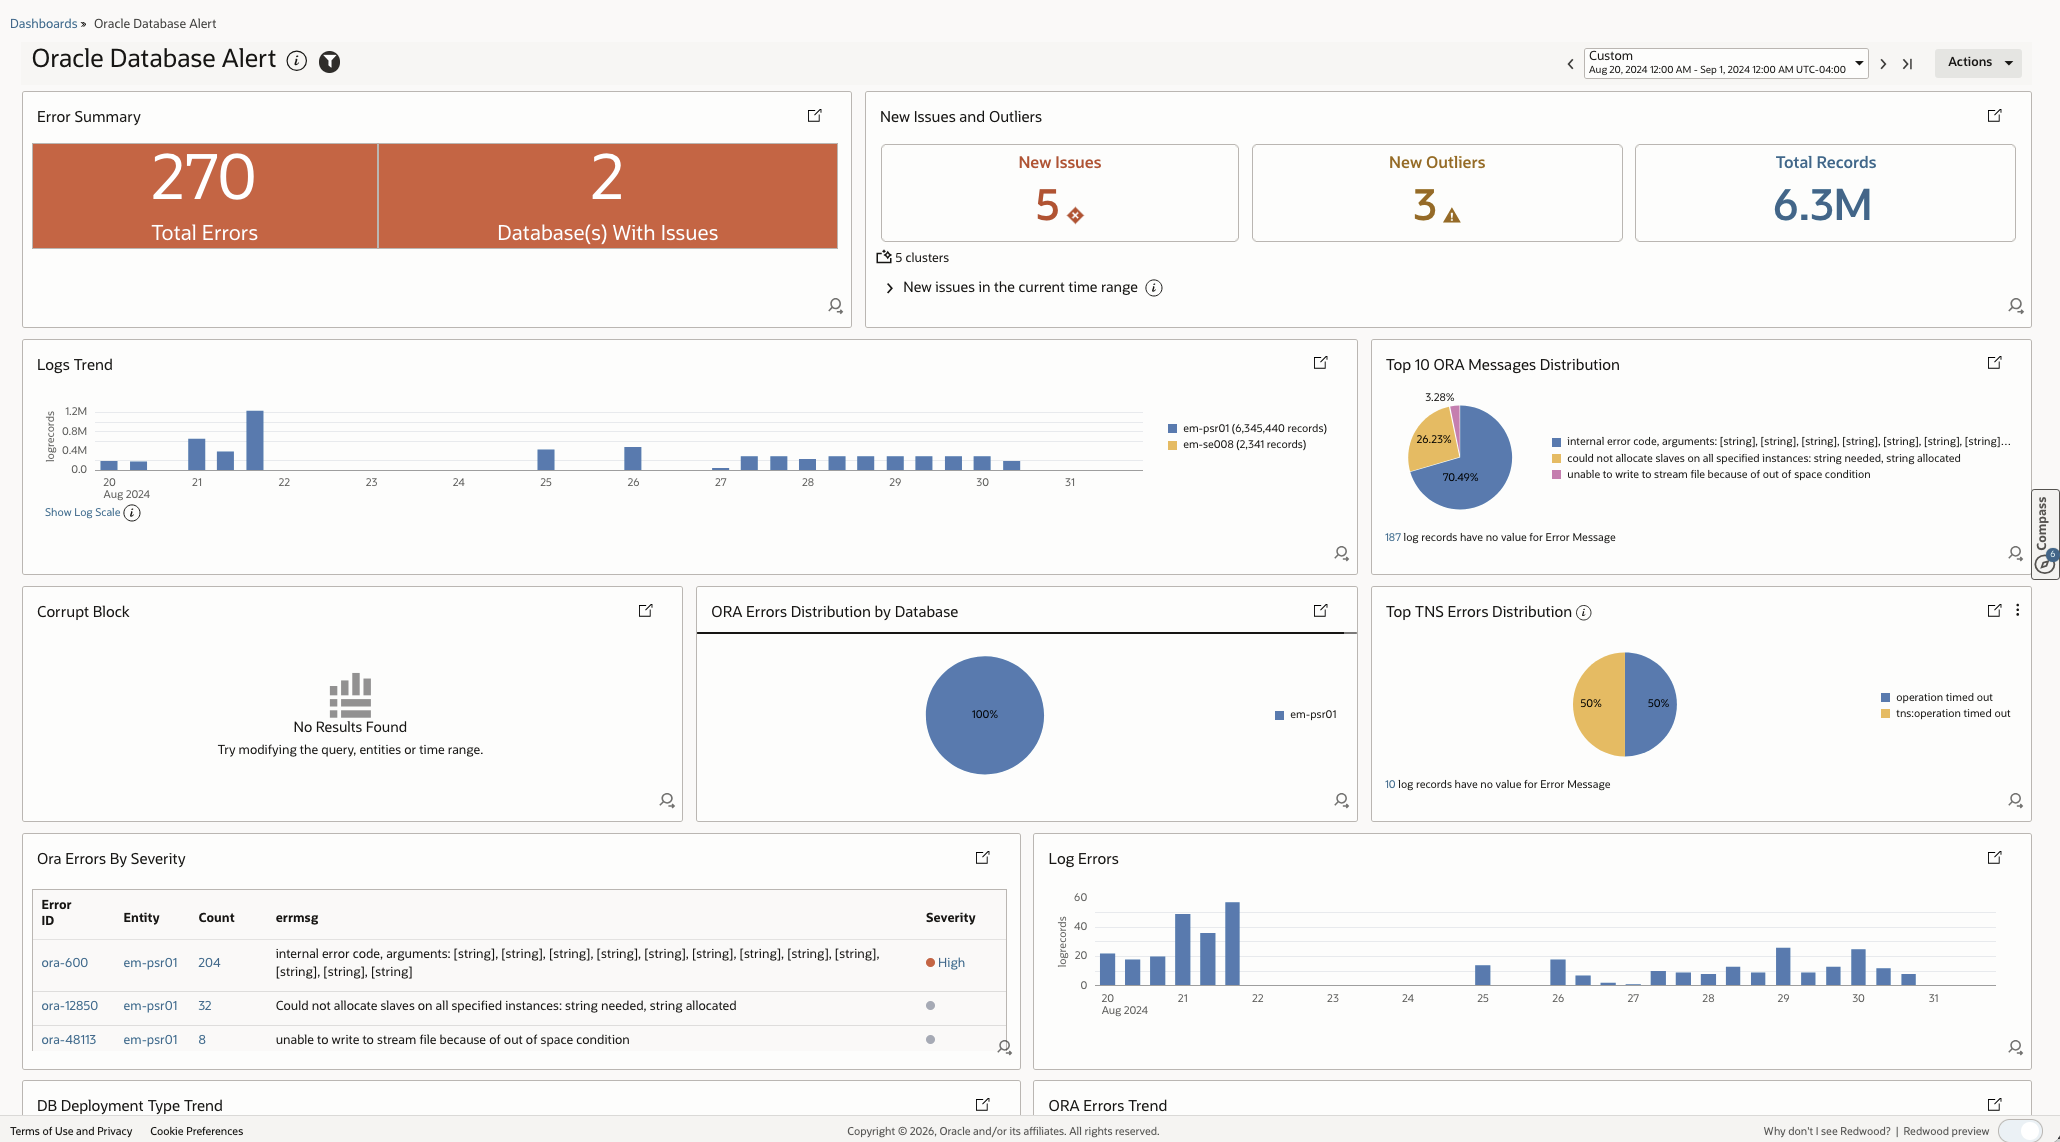
Figure 21. Oracle Database Alert dashboard populated in a sample environment. Use its widget layout as the starting point, then scope the duplicated dashboard to the ExaDB-D log group and database entities. The displayed sample counts and entity names are not results from the ORADBRAC1 and ORADBRAC2 walkthrough.
For the multicloud operations view, extend the duplicate with collection coverage, listener failures, and GI and ASM events. Keep the same time, log-group, and entity scope across widgets so operators can move from a fleet-level symptom to the contributing database and infrastructure records.
Turn the dashboard into an operating routine
For the connection-failure scenario, use the database and listener panels to identify affected instances, then inspect GI and ASM records in the same window. Ask LoganAI to summarize the selected evidence and suggest the next investigation step; verify its response against the original records before recording an RCA conclusion.
Save useful searches as dashboard widgets, validate that their filters apply to every intended source, and document what each count means. Once the query and threshold have been tested, selected searches can feed scheduled detection and alerting workflows. Scheduled searches
Track the collection pipeline as part of the same routine. Review agent health, warnings, new VM onboarding, and log volume. Retain frequently used diagnostics for the required investigation period, and add high-volume traces with a clear use case. These decisions keep the fleet dashboard useful as the environment changes.
Conclusion
OCI Log Analytics gives Oracle Database@AWS ExaDB-D and ExaC@C operations a common way to work with distributed diagnostic evidence. Its value comes from connecting Oracle-aware source configuration with repeatable investigation: identify an affected instance, follow the related database and GI messages, inspect guest-host evidence, and share a query that another operator can reproduce.
Begin with one VM cluster. Validate the ZIP installation, environment-specific network path, source associations, file rotation, timestamps, and extracted fields, then expand the validated database and GI collection pattern across the Oracle Database@AWS or ExaC@C fleet.