Fusion Apps Observability Part 2: ESS Job Performance Analysis with BI Publisher SOAP Log Ingestion
Fusion Apps Observability Part 2: ESS Job Performance Analysis with BI Publisher SOAP Log Ingestion
Introduction
In Part 1, we used the Oracle Fusion Applications Scheduler REST API and OCI Log Analytics REST API collection to ingest Enterprise Scheduler Service (ESS) request data. The Management Agent collected request records at regular intervals, while Log Analytics retained the history and presented request status, application, product, and observed schedule activity through the first-generation Oracle Fusion Apps Enterprise Scheduler Service (ESS) Analysis solution.
As customers used that solution, we heard an important limitation: some ESS job requests that operators expected to investigate were not displayed or captured. When a request was absent from the collected data, its status, timing, and execution context were unavailable in Log Analytics, leaving many affected jobs difficult to troubleshoot.
This feedback motivated a new collection approach. Instead of relying only on the Scheduler REST API endpoint, a custom BI Publisher report retrieves and summarizes a broader set of ESS job-request activity and performance context. The Management Agent uses a SOAP-compatible OCI Log Analytics REST API source to call BI Publisher ReportService, extract and Base64-decode reportBytes, and parse the resulting XML. The goal is to improve ESS request coverage and give operators more context for troubleshooting; collection completeness should still be validated against known requests in each environment.
Ranveer Tiwari’s ESS Job Health & Risk Observatory demonstrates how a custom BI Publisher report can also provide job-level counters, historical baselines, runtime-regression signals, risk scores, confidence measures, and alert context. Its original architecture uses Oracle Integration Cloud (OIC) to call BI Publisher, decode and normalize the response, and expose the data through REST.
This Part 2 article retains that BI Publisher report and its job-health logic while simplifying the telemetry path. The Management Agent calls BI Publisher directly, so OIC is not required solely as a telemetry relay. The BI Publisher data model supplies the broader ESS data and derived metrics; SOAP provides the transport.
The primary monitoring use cases are:
- Improve visibility into ESS job-request activity that was not captured by the first-generation REST-based collection.
- Investigate cancelled jobs and jobs that remain running or blocked.
- Identify long-running jobs and runtime regressions relative to historical baselines.
- Prioritize jobs with elevated failure, SLA-breach, or stuck-job probability.
- Retain the resulting history in Log Analytics for search, correlation, dashboards, detections, and alerts.
BI Publisher report-execution audit is included as a separate companion use case. It shows who executed which BI Publisher report, when it ran, how it was invoked, and how it performed. It shares the ReportService SOAP, reportBytes, Base64-decoding, and XML-parsing pattern, but it remains separate from ESS job monitoring.
Addressing ESS Monitoring Gaps with a New Log Collection Paradigm
The first-generation ESS monitoring solution established a useful foundation by collecting Scheduler REST API records in OCI Log Analytics. Customer feedback, however, revealed a practical coverage gap: some ESS job requests that operations teams expected to investigate were not represented in the collected data. When those requests—or the metadata needed to understand them—were unavailable, troubleshooting cancelled, stuck, or long-running jobs became difficult.
To address these gaps, we are enhancing the Fusion Applications monitoring solution with a new log collection paradigm. A Management Agent invokes a custom BI Publisher report through a SOAP-compatible OCI Log Analytics REST API source. The report retrieves and summarizes a broader set of ESS job request activity, enriches it with important operational metadata, and returns the results through BI Publisher reportBytes. Log Analytics then decodes the response, parses the report-specific XML, and retains the resulting records for analysis.
The additional coverage and metadata provide the context needed to analyze ESS jobs across execution windows rather than as isolated request records. Operations teams can identify cancelled or blocked jobs, find jobs that remain running longer than expected, recognize runtime regressions and recurring failures, and prioritize jobs with elevated stuck-job or SLA-breach risk. Job identity, execution timestamps, status counters, runtime measures, and application and product context also make it easier to understand what happened and determine where investigation should begin.
The BI Publisher SOAP collection path enhances the existing REST-based approach rather than universally replacing it. Scheduler REST records remain useful when detailed information about an individual request is required. The new collection paradigm fills the earlier visibility and context gaps, providing broader ESS request coverage and a more comprehensive foundation for ESS performance monitoring and troubleshooting.
Reference Architecture: Direct BI Publisher SOAP Collection
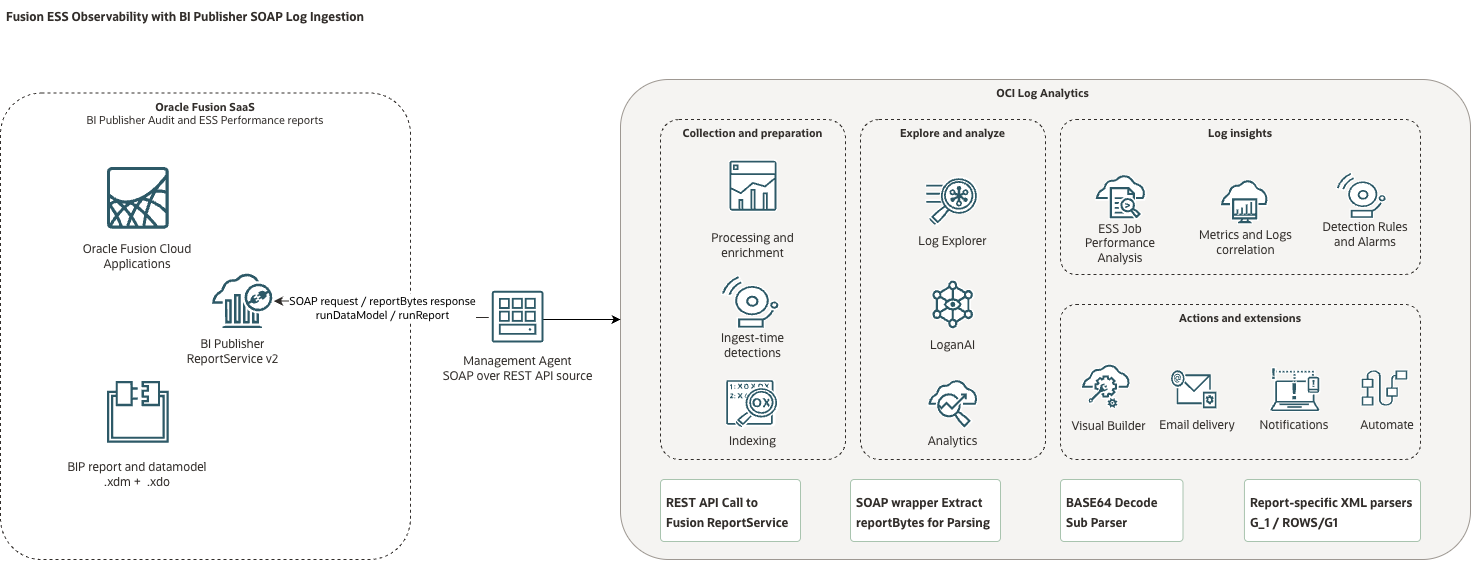
Figure 1 illustrates how the new collection paradigm brings ESS performance data directly from Oracle Fusion Applications into OCI Log Analytics. A Management Agent can run on OCI Compute or on-premises, provided it has outbound HTTPS access to the Fusion BI Publisher endpoint.
Although the collection is configured as an OCI Log Analytics REST API source, the Management Agent sends a SOAP XML request to BI Publisher ReportService v2. The ESS source invokes runReport, while the companion BI Publisher execution-audit source invokes runDataModel. Both operations return the requested report data inside reportBytes.
Within Log Analytics, the first processing stage extracts reportBytes from the SOAP response. A Base64-decoding subparser then restores the report XML, and a report-specific parser maps each XML record and field into the Log Analytics data model. The SOAP transport and decoding stages are reusable, but the final XML parser must match the report being collected.
The broader ESS monitoring coverage comes from the custom BI Publisher report and its data model, which determine which ESS requests, operational metadata, counters, and derived performance signals are returned. SOAP provides the transport that allows the Management Agent to collect that information directly.
This direct path removes the need to use Oracle Integration Cloud solely as a telemetry relay. OIC remains appropriate when the integration requires multi-system orchestration, shared transformations, approval logic, or a separately managed REST contract. When Log Analytics is the only consumer and can parse the BI Publisher XML directly, the Management Agent approach reduces the number of components required for collection.
Two Monitoring Use Cases, One Shared SOAP Collection Pattern
The architecture uses two independent OCI Log Analytics sources. Both call BI Publisher ReportService, extract and Base64-decode reportBytes, and parse the resulting XML. However, they invoke different BI Publisher operations, use different report data models, and require different final XML parsers. Their records must remain separate because they answer different monitoring questions.
ESS Job Performance: Fusion_ESSHealthRPT_SOAP
Fusion_ESSHealthRPT_SOAP is the primary source for the ESS monitoring use cases in this article. It invokes runReport against the following custom BI Publisher report:
/Custom/ESSHealth/ESSHealthRPT.xdo
The source requests txml output on a 10-minute collection interval. After decoding the SOAP response, the parser treats each /DATA_DS/ROWS/G1 element as a job-centric health record and maps REQUEST_EVENT_TIME to the canonical Log Analytics Time field.
Each record summarizes the activity of an ESS job rather than representing one individual ESS request. The BI Publisher data model combines recent execution counters with longer-term runtime baselines, job identity, application and product context, risk scores, confidence measures, and alert information. This compressed model supports analysis of cancelled jobs, jobs that remain running or blocked, long-running or runtime-regressing jobs, recurring failures, and jobs with an elevated probability of becoming stuck or breaching an SLA.
This job-centric model complements the request-level records collected through the Scheduler REST API. The REST records remain useful for examining an individual request, while the BI Publisher source provides the broader operational context needed to identify patterns across multiple executions.
Companion BIP Report-Execution Audit: Fusion BIP Audit SOAP
Fusion BIP Audit SOAP supports the separate BI Publisher report-execution audit use case. It invokes runDataModel against:
/Custom/Audit/Data Models/BIP Audit Report DM.xdm
After decoding the response, the parser treats each /DATA_DS/G_1 element as a report-execution record. It captures who executed which report, when the execution started and ended, how the report was invoked, whether it succeeded, whether it used the BI Publisher cache, how many rows it processed, how long it ran, and which ECID and session identify the execution.
The parser maps START_DT to Job Start Time and END_DT to Job Completion Time. It does not assign the canonical Log Analytics Time field, so time-based dashboard visualizations use ingestion time unless the source mapping is enhanced.
This source collects BIPReportAuditTrail execution activity. It is not the BIPCatalogObjectAuditTrail, which records actions such as updating, deleting, or copying BI Publisher catalog objects. The two audit trails serve different purposes and should not be presented as the same form of audit monitoring.
Get Operational Insights into Fusion Enterprise Scheduler Job Requests
The immediate value of the new collection paradigm is the operational insight it provides into Fusion Enterprise Scheduler job requests. The ESS Job Health & Risk Observatory turns the collected ESS activity, performance baselines, and calculated health signals into a consolidated operational view.
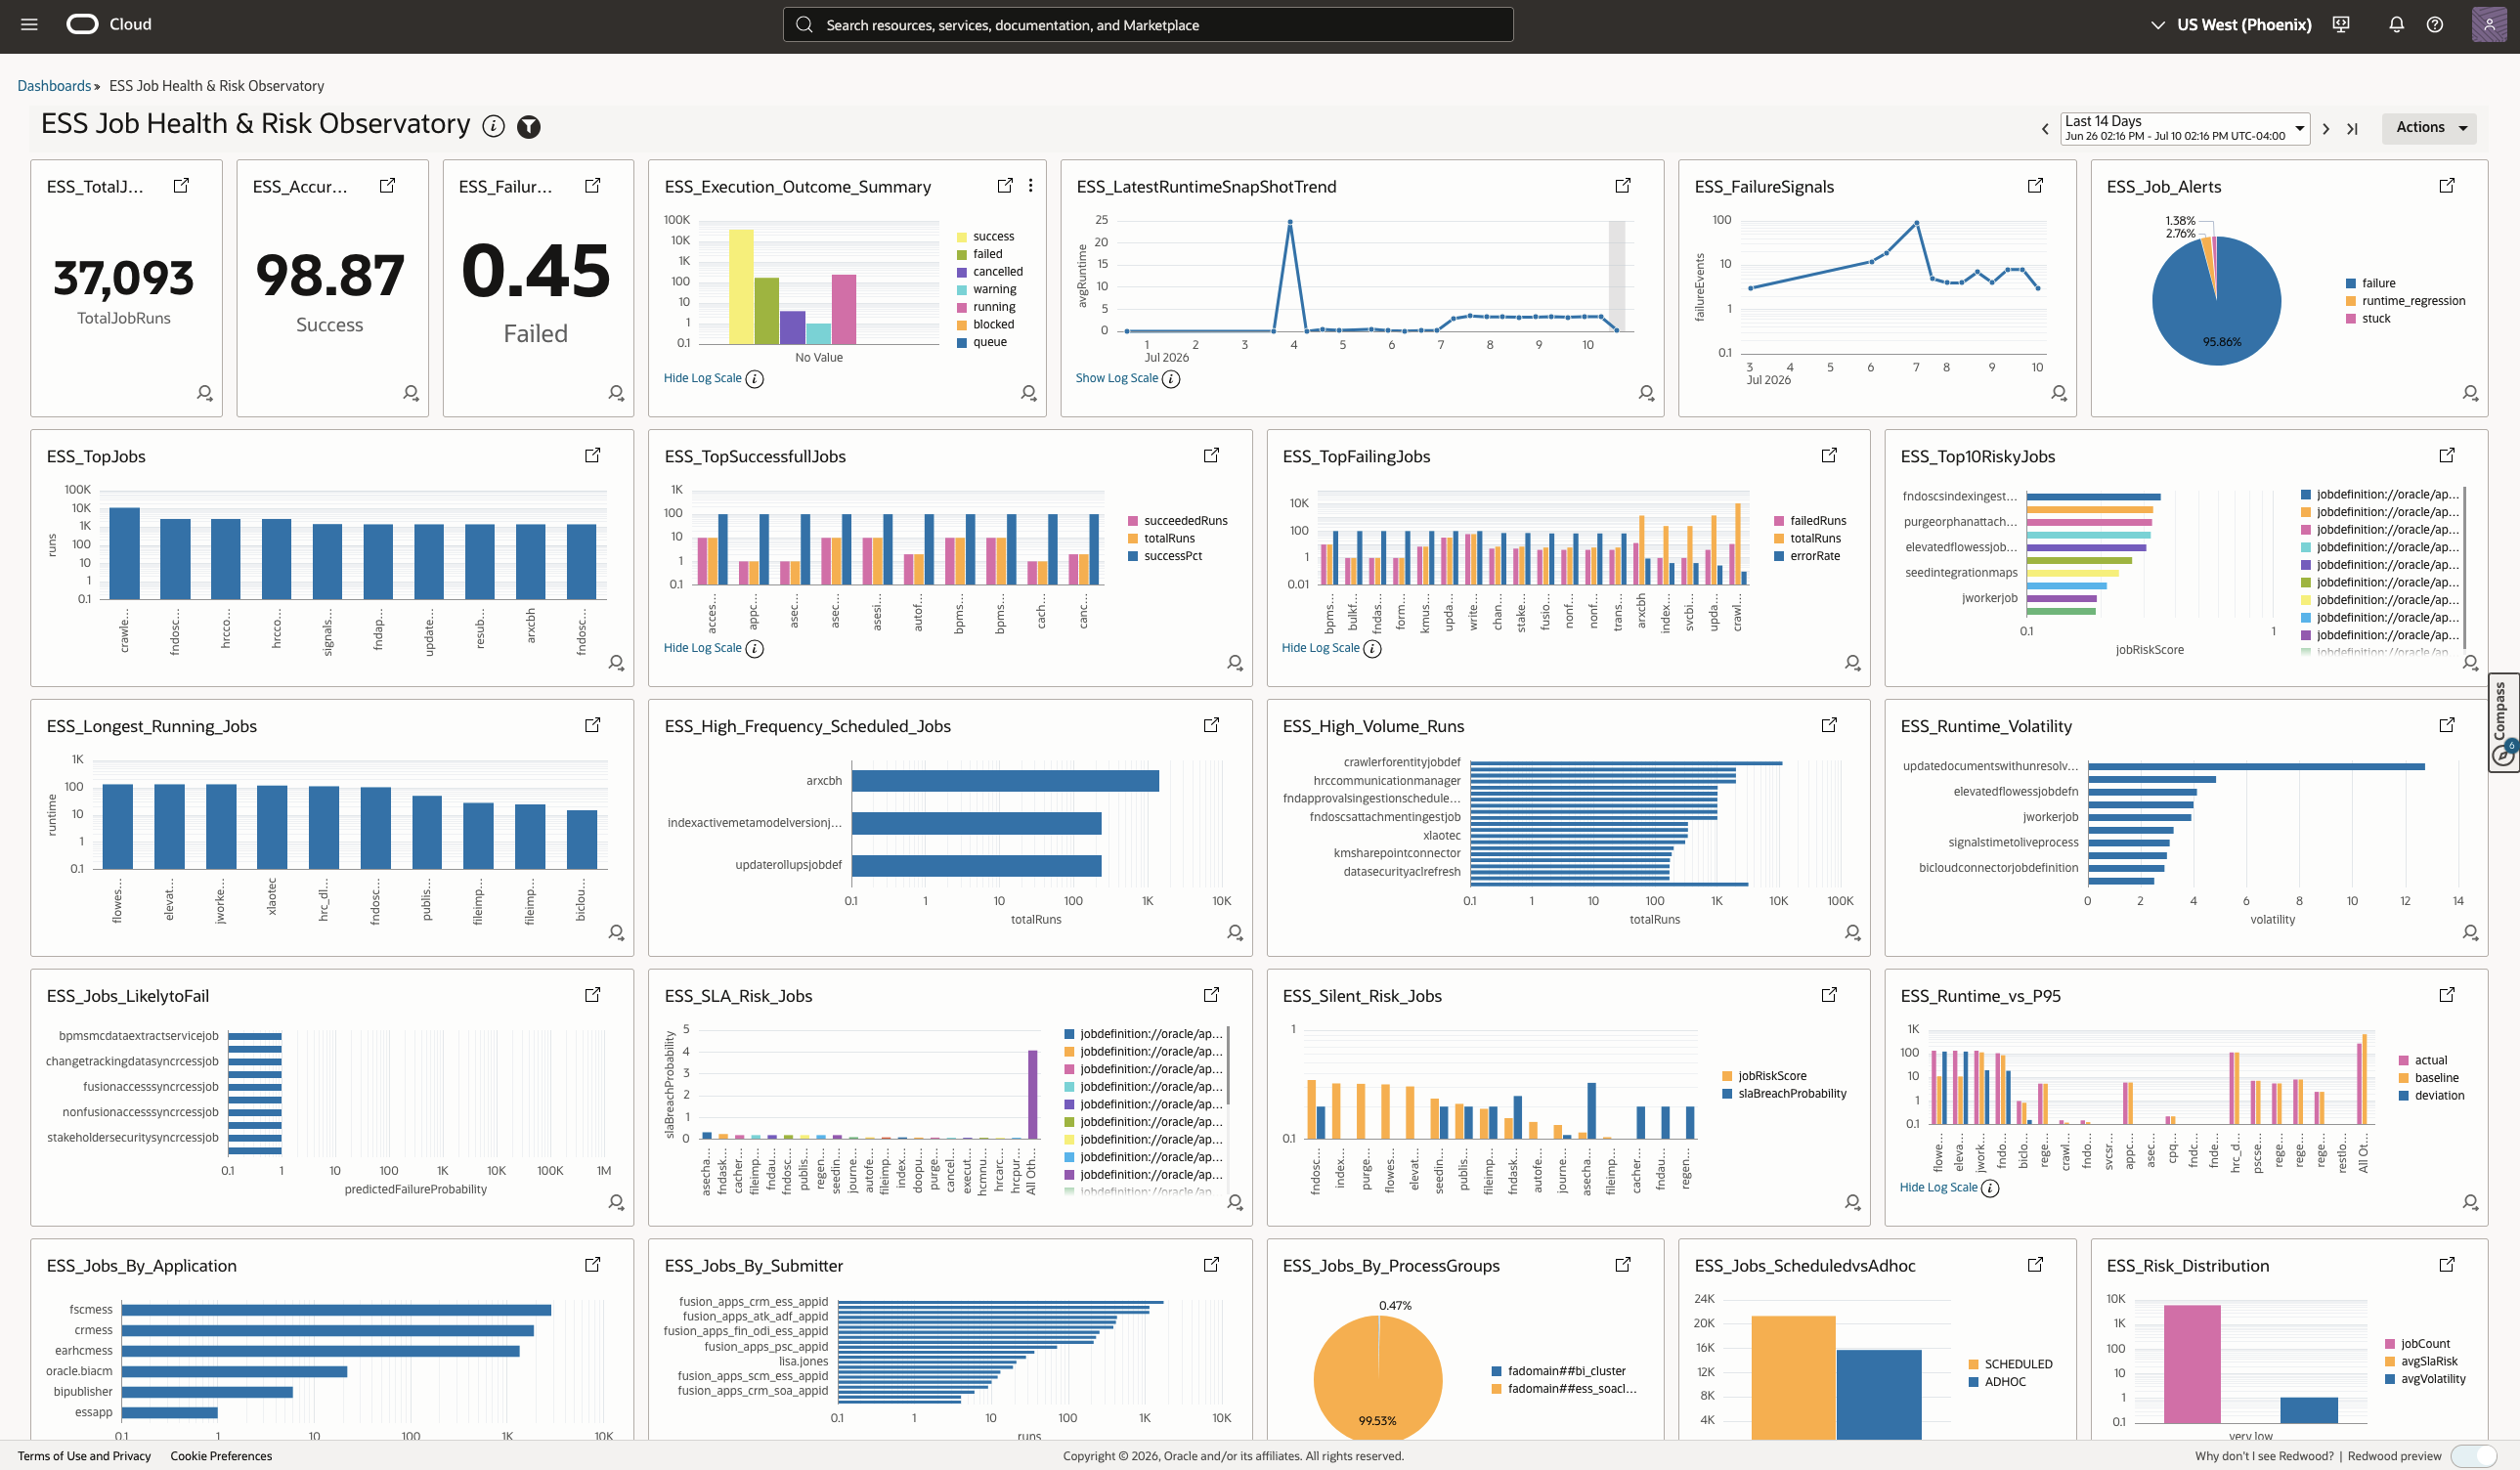
The dashboard helps Fusion Applications operations teams answer the questions they most frequently ask about ESS workload health:
- Measure the ESS execution success rate. Understand the percentage of ESS executions that completed successfully during the selected period.
- Track the ESS failure rate. Determine whether failures are isolated events or indicate a broader degradation in ESS workload health.
- Find the top failing jobs. Rank jobs by failed executions and error rate so that the most persistent failures can be investigated first.
- Prioritize the top risky jobs. Identify jobs with the highest calculated risk scores based on failures, runtime behavior, SLA exposure, and other health signals.
- Detect high-volume runs. Find jobs with the greatest execution volume and determine whether unexpectedly frequent runs are contributing to system load.
- Analyze runtime volatility. Identify jobs whose execution durations vary significantly and may therefore be difficult to predict or schedule reliably.
- Identify long-running jobs. See which jobs have the longest runtimes, including the job name or definition and the observed runtime that requires investigation.
- Find the applications with the most ESS activity. Understand which Fusion Applications generate the greatest ESS job volume and where operational attention may be concentrated.
- Identify the top ESS submitters. See which user or application identities submit the most ESS jobs, including service identities used by Fusion Applications.
- Review jobs with calculated risk scores. Examine the broader list and distribution of jobs with risk indicators, rather than limiting the analysis to only the highest-risk jobs.
Together, these dashboard views allow an operator to move from service-level health to workload patterns and then to the specific jobs that require attention. Success rate, failure rate, execution outcomes, and high-volume runs summarize activity within the selected reporting period. Long-running, runtime-volatility, regression, and risk views combine the latest job state with historical execution baselines.
The calculated risk and probability values are prioritization signals rather than guarantees of a future outcome. Operators should use them to identify where an investigation should begin and then confirm the underlying ESS request status, timestamps, and execution details before taking corrective action.
Prerequisites
Before configuring the ESS SOAP collection, confirm the following requirements:
- Fusion administrator access that can import a BI Publisher catalog, manage catalog permissions, and provision a service account.
- An OCI tenancy and compartment in which you can configure Log Analytics resources, Management Agents, entities, log groups, saved searches, and dashboards.
- A client host or OCI Compute instance with outbound HTTPS connectivity to the Fusion Applications endpoint. This host runs the Management Agent used for source-entity association.
- Access to the ESS Health catalog, Log Analytics source package, endpoint-validation script, and dashboard packages referenced in the following steps.
If you also deploy the companion BI Publisher report-execution audit use case, confirm separately that /Custom/Audit/Data Models/BIP Audit Report DM.xdm exists and that the collection account can execute it. This source uses the BI Publisher runDataModel operation. Access to the ESS Health report does not automatically provide access to the BI Publisher audit data model.
Configure the ESS Health SOAP Collection
Ranveer Tiwari’s original ESS Job Health & Risk Observatory established the BI Publisher report, service-account requirements, health and risk analysis, and an OIC-based collection architecture. This article builds on that work and adapts the collection path for direct ingestion through the OCI Management Agent.
This procedure reuses only the first two Fusion preparation steps from Ranveer’s installation guide: installing ESSHealth.catalog and provisioning a Fusion service account with access to BI Publisher and ESS job data. The OIC configuration is not required because the Management Agent connects directly to BI Publisher ReportService. The original documentation and supporting artifacts remain available in the ESS Job Health & Risk Observatory GitHub repository.
Step 1: Install the ESS Health BI Publisher catalog
Download ESSHealth.catalog from the ESS Job Health & Risk Observatory repository.
Sign in to Fusion BI Publisher:
https://<fusion-host>/analytics
Open the BI Publisher catalog, navigate to /shared/Custom, and select Unarchive. In the Unarchive dialog, select the downloaded ESSHealth.catalog file, as shown in Figure 3.
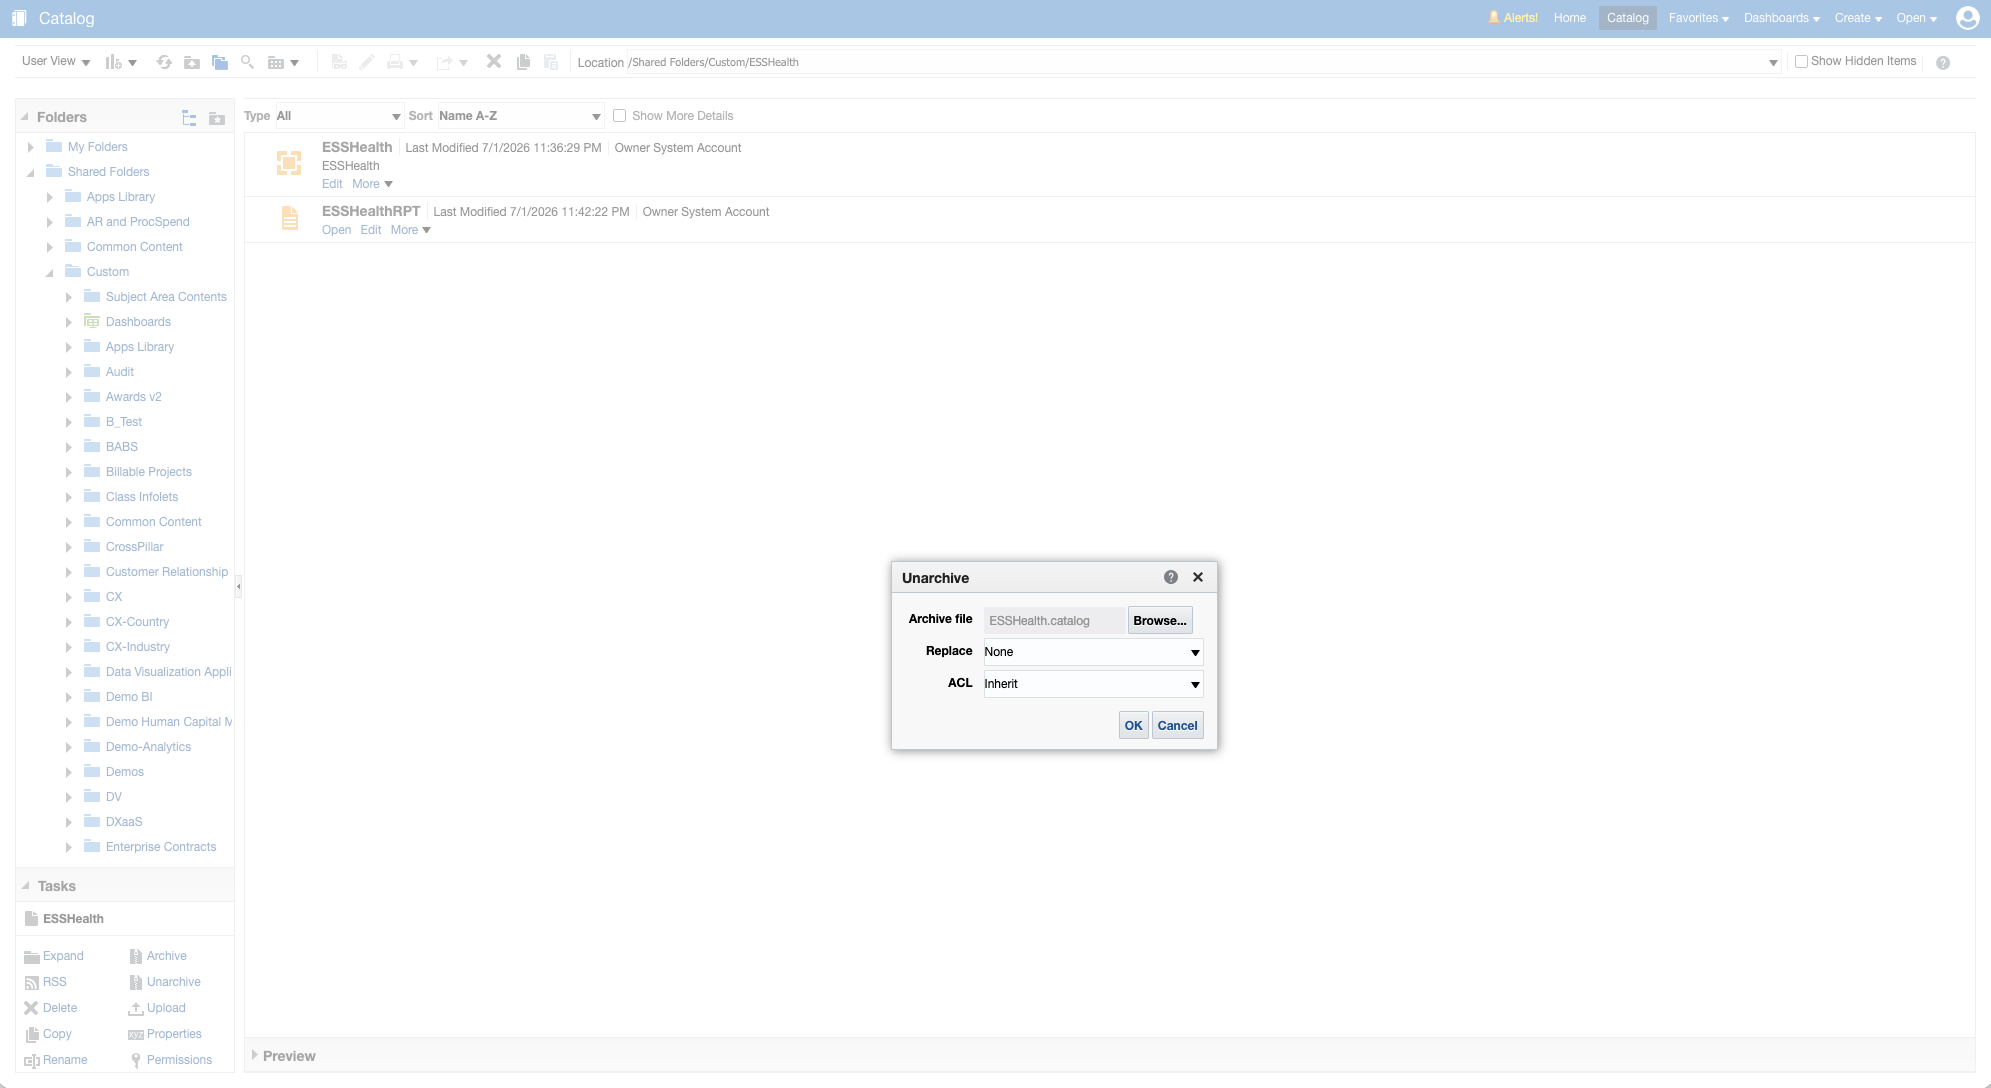
For this direct SOAP implementation, unarchive the catalog under /shared/Custom rather than the Human Capital Management folder. Verify that the operation creates /shared/Custom/ESSHealth and that the ESSHealth data model and ESSHealthRPT report are present.
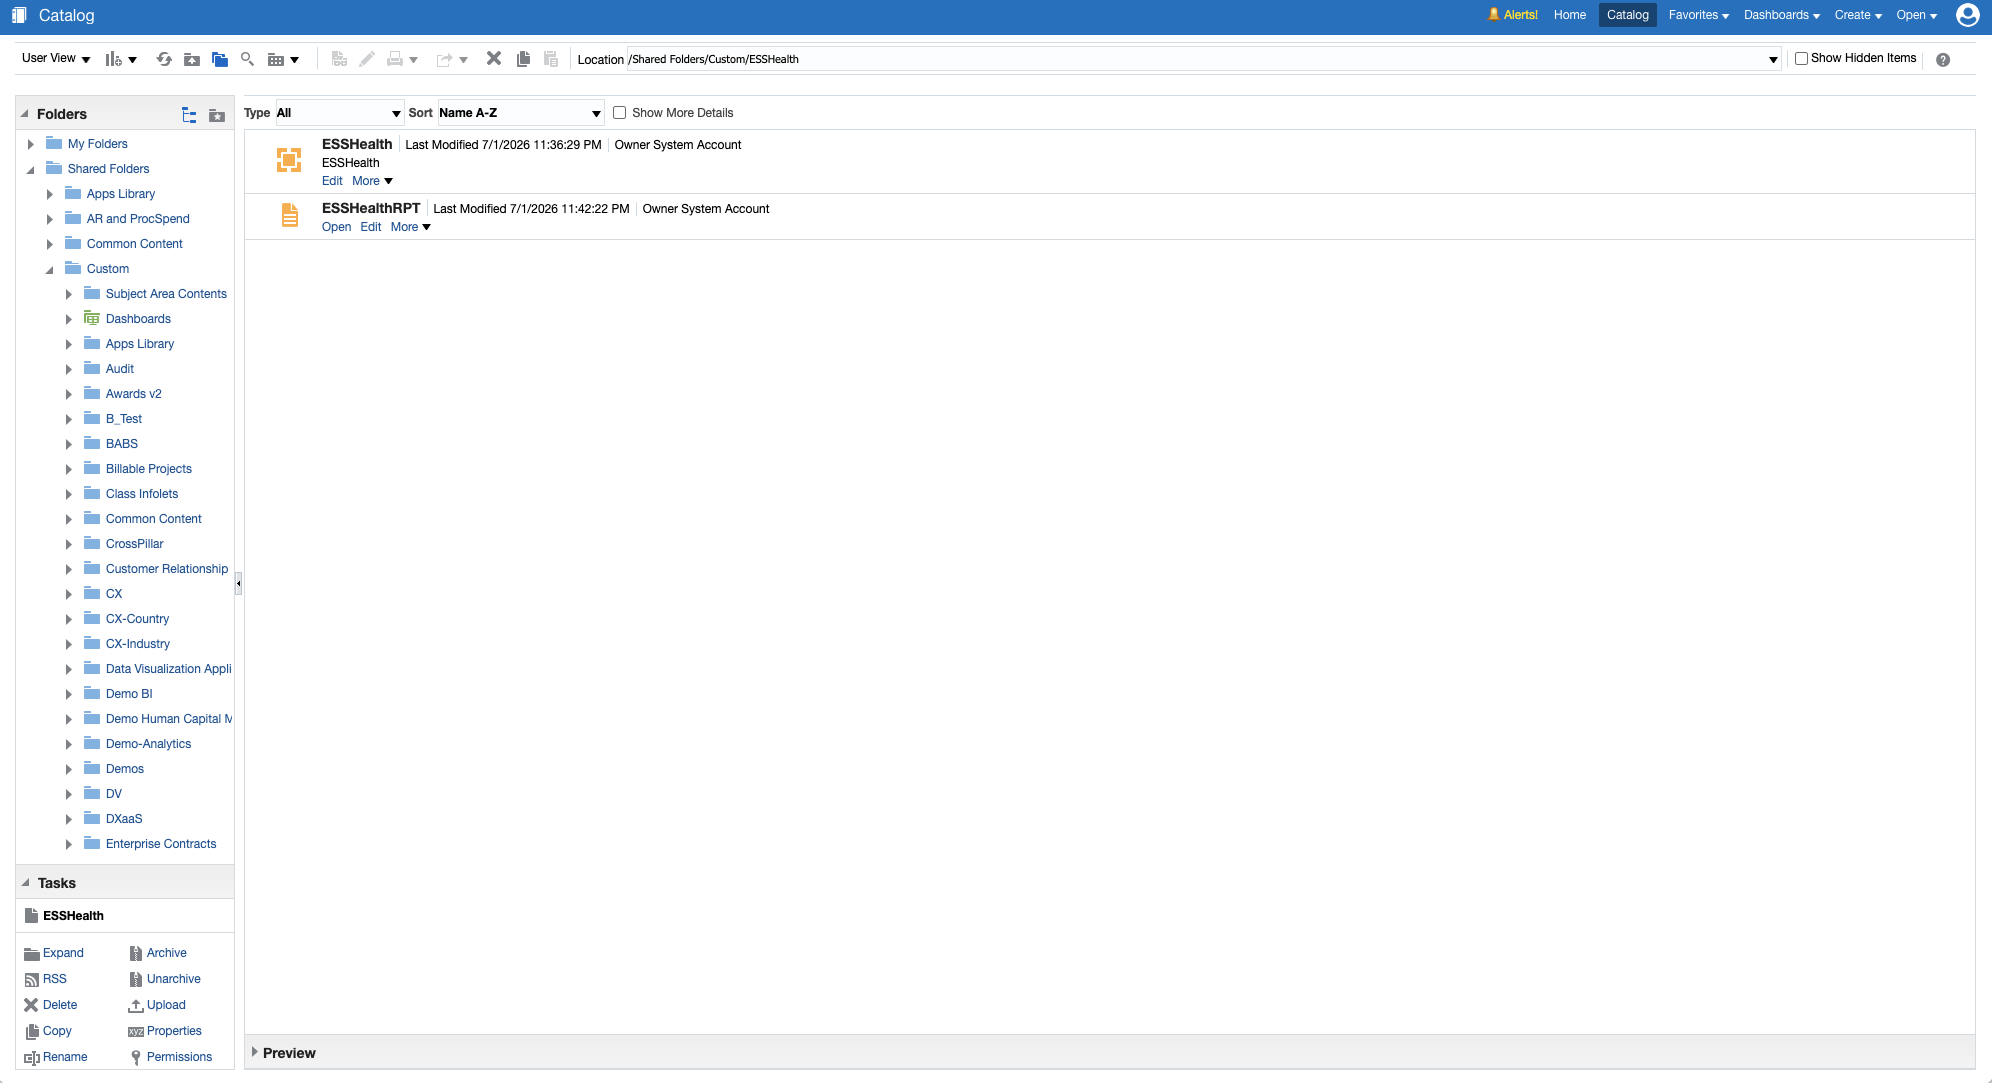
The imported Log Analytics source calls this exact report path:
/Custom/ESSHealth/ESSHealthRPT.xdo
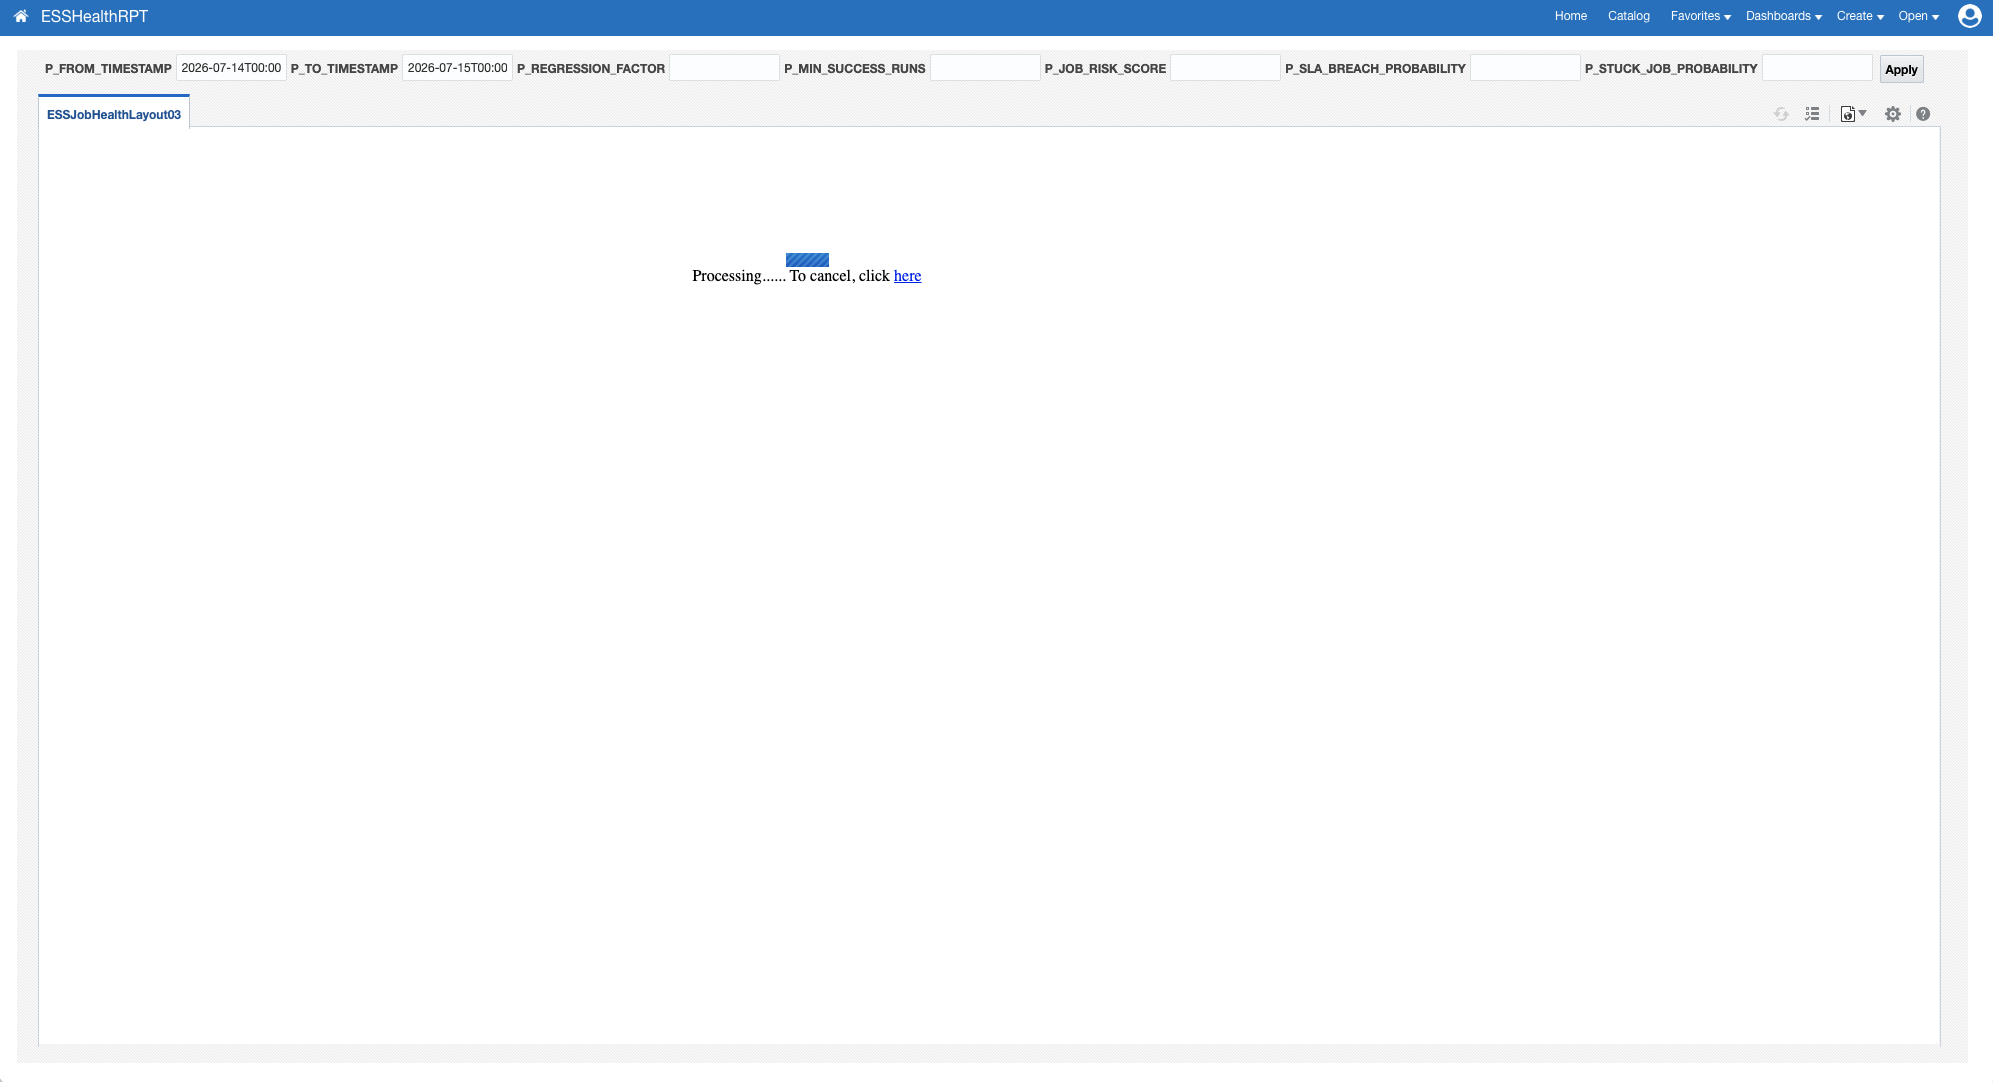
Run ESSHealthRPT in BI Publisher with a short period containing known ESS activity. Confirm that the report completes and returns job health records before continuing.
Step 2: Provision the Fusion service account
Create or identify a dedicated Fusion service account for ESS monitoring collection. Assign the following Fusion roles:
BI Consumer Role: BIConsumer
ESS Monitor Role: ESSMonitor
If your Fusion security model groups these permissions through a custom abstract role, you can follow the original installation guide and create an ESS_Monitor role containing the required access.
Grant the account permission to open and execute the report under /shared/Custom/ESSHealth. Catalog permissions and Fusion application roles are separate controls, so validate both.
After creating or changing the role assignments, run the following Fusion scheduled process if required by your environment:
Import User and Role Application Security Data
Confirm that the service account can execute ESSHealthRPT and read the underlying ESS job data without catalog, data-source, or authorization errors.
Step 3: Provision the Management Agent and enable REST API collection
This step adapts the Management Agent preparation from Part 1: Fusion Apps Observability by Collecting ESS Logs Using OCI Logging Analytics REST API Ingestion.
Complete these prerequisites:
- Set up the Log Analytics service policies and user permissions. See Enable Access to Log Analytics and Its Resources and Prerequisite IAM Policies.
- Install the Management Agent on a client host VM that has HTTP or HTTPS access to the Fusion Applications endpoint. Deploy the Log Analytics plug-in during installation and use this host for the source-entity association. See Install Management Agents and Set Up Continuous Log Collection Using Management Agent.
- On OCI Compute, you can enable the Management Agent through the Oracle Cloud Agent. See Deploy Management Agents on Compute Instances.
- Create or edit an entity of type
Oracle Fusion Applications, select the Management Agent, and configure the requiredlogin_urlandpod_urlproperties. See Create Log Analytics Resources and Set Up REST API Log Collection. - From the Management Agent host, verify DNS resolution and HTTPS access to
https://<fusion-host>/xmlpserver/services/v2/ReportService. Oracle’s REST API log collection procedure recommends checking endpoint reachability from the agent host with a tool such ascurl.
On Unix-based hosts, the agent operating-system user depends on the deployment:
Standalone Management Agent:  mgmt_agent
Oracle Cloud Agent plug-in:   oracle-cloud-agent
Although the Fusion endpoint uses SOAP, Log Analytics uses its REST API source type to send the HTTP POST request and collect the XML response.
Locate emd.properties in the appropriate Management Agent configuration directory:
Oracle Cloud Agent plug-in:
/var/lib/oracle-cloud-agent/plugins/oci-managementagent/polaris/agent_inst/config/

Standalone Management Agent:
/opt/oracle/mgmt_agent/agent_inst/config/
Enable REST API collection and set the polling interval to ten minutes:
loganalytics.rest_api.enable_oci_api=true
loganalytics.rest_api.report_interval=600
Restart the applicable agent service and confirm that the agent returns to an active state:
Oracle Cloud Agent:
sudo systemctl restart oracle-cloud-agent

Standalone Management Agent:
sudo systemctl restart mgmt_agent
Step 4: Register the Fusion credential
Create a temporary credential file named FA-BIP-BASIC.json. The current Oracle REST API collection format uses HTTPSBasicAuthCreds for a Basic Authentication credential:
{
  "source": "lacollector.la_rest_api",
  "name": "FA-BIP-BASIC",
  "type": "HTTPSBasicAuthCreds",
  "description": "These are HTTPS Basic Authentication credentials.",
  "properties": [
    {
      "name": "HTTPSUserName",
      "value": "CLEAR[<fusion-service-account>]"
    },
    {
      "name": "HTTPSPassword",
      "value": "CLEAR[<fusion-service-account-password>]"
    }
  ]
}
This example is for a Fusion HTTPS endpoint whose certificate chain is already trusted by the Management Agent host. If you must explicitly provide a JKS trust store, Oracle documents HTTPSCreds as the credential type that accepts ssl_trustStoreType, ssl_trustStoreLocation, and ssl_trustStorePassword. Do not add those properties to an HTTPSBasicAuthCreds credential.
Protect the temporary file with owner-only permissions:
chmod 600 /tmp/FA-BIP-BASIC.json
Register it with the credential-management utility for your installation type:
Oracle Cloud Agent plug-in:
cat /tmp/FA-BIP-BASIC.json | sudo sh /var/lib/oracle-cloud-agent/plugins/oci-managementagent/polaris/agent_inst/bin/credential_mgmt.sh -o upsertCredentials -s logan

Standalone Management Agent:
cat /tmp/FA-BIP-BASIC.json | sudo sh /opt/oracle/mgmt_agent/agent_inst/bin/credential_mgmt.sh -o upsertCredentials -s logan
Securely remove the temporary credential file after registration. The imported source selects BASIC_AUTH and references the credential as:
FA-BIP-BASIC:BASIC_AUTH
The SOAP request uses only {USERNAME} and {PASSWORD}. The Management Agent replaces these macros from the selected credential at collection time. Never place literal Fusion credentials in the source package, SOAP payload, article, scripts, screenshots, or dashboard files.
Step 5: Test the BI Publisher endpoint
Use run_ess_health_rpt.sh to validate the report through BI Publisher ReportService before enabling scheduled collection. The script requires zsh, curl, sed, perl, base64, and xmllint.
From the repository root, use an explicit Fusion URL, service-account name, and short UTC test window. Do not append Z to the timestamp values accepted by this script. Omit BIP_PASSWORD so that the script prompts for it without echoing it:
chmod +x ./scripts/run_ess_health_rpt.sh
umask 077
BIP_BASE_URL='https://<fusion-host>' \
BIP_USER='<fusion-service-account>' \
P_FROM_TIMESTAMP='2026-07-15T18:00:00.000' \
P_TO_TIMESTAMP='2026-07-15T19:00:00.000' \
OUTPUT_DIR='./output/esshealthrpt-test' \
./scripts/run_ess_health_rpt.sh
The script loads an environment file only when ENV_FILE is explicitly set. For an interactive validation, leave both ENV_FILE and BIP_PASSWORD unset so the password is not read from a plaintext file or supplied through the child-process environment.
The script posts runReport to:
https://<fusion-host>/xmlpserver/services/v2/ReportService
It calls /Custom/ESSHealth/ESSHealthRPT.xdo, checks for an HTTP success response and non-empty reportBytes, Base64-decodes the report content, validates the DATA_DS XML, and requires at least one /DATA_DS/ROWS/G1 record.
Inspect the generated decoded XML and confirm that representative records contain REQUEST_EVENT_TIME and the expected ESS metadata. The script validates the decoded record structure but does not validate every individual field.
The request, response, and decoded report files can contain usernames, request details, or other sensitive ESS metadata. Retain the restrictive umask, protect the output directory, and remove test artifacts when they are no longer required.
Step 6: Import the ESS Health SOAP source
In Log Analytics, navigate to:
Administration
  -> Administration Overview
  -> Import Configuration Content
Import Fusion_ESSHealthRPT_SOAP_1784581422642.zip.
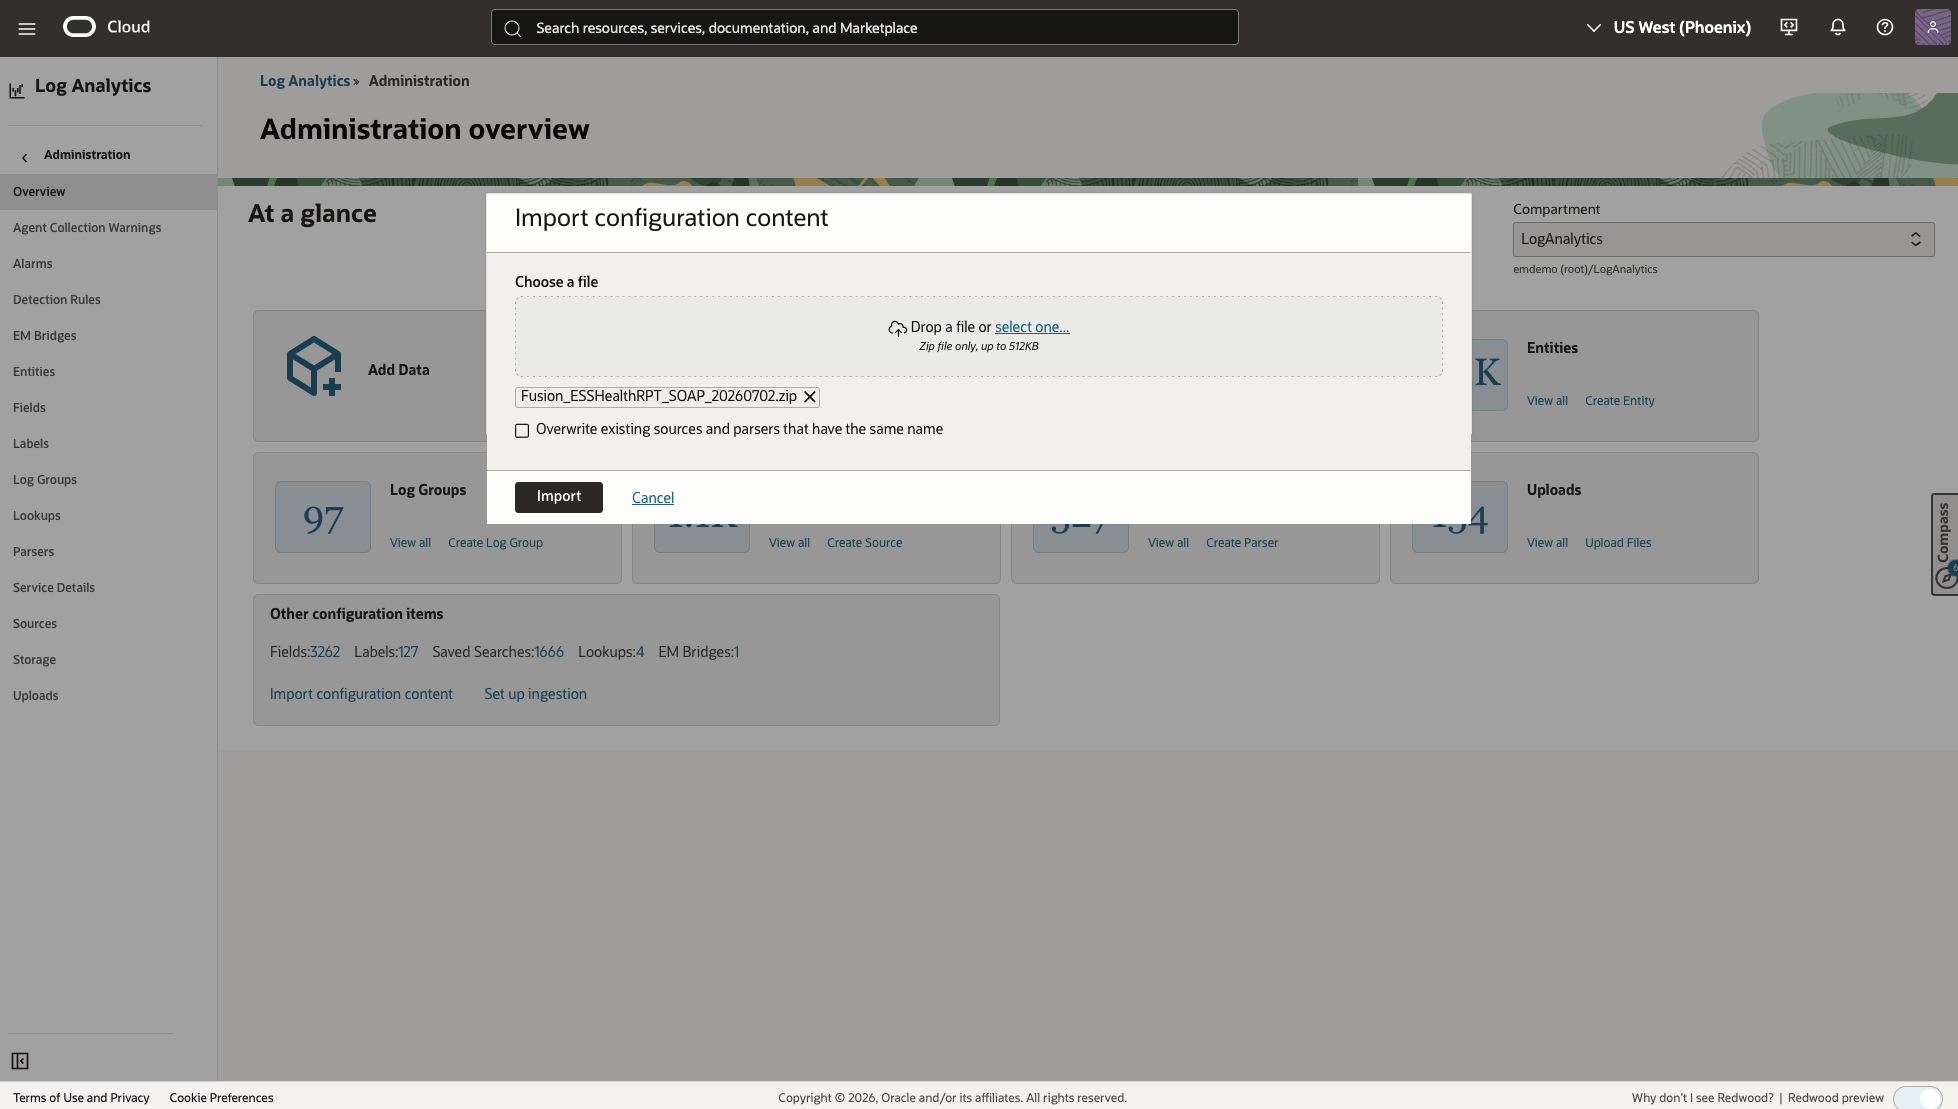
After the import, verify these objects:
Source:         Fusion_ESSHealthRPT_SOAP
Wrapper parser: Fusion_ESSHealthRPT_SOAP_ReportBytes_XML
Decoded parser: Fusion_ESSHealthRPT_Decoded_XML
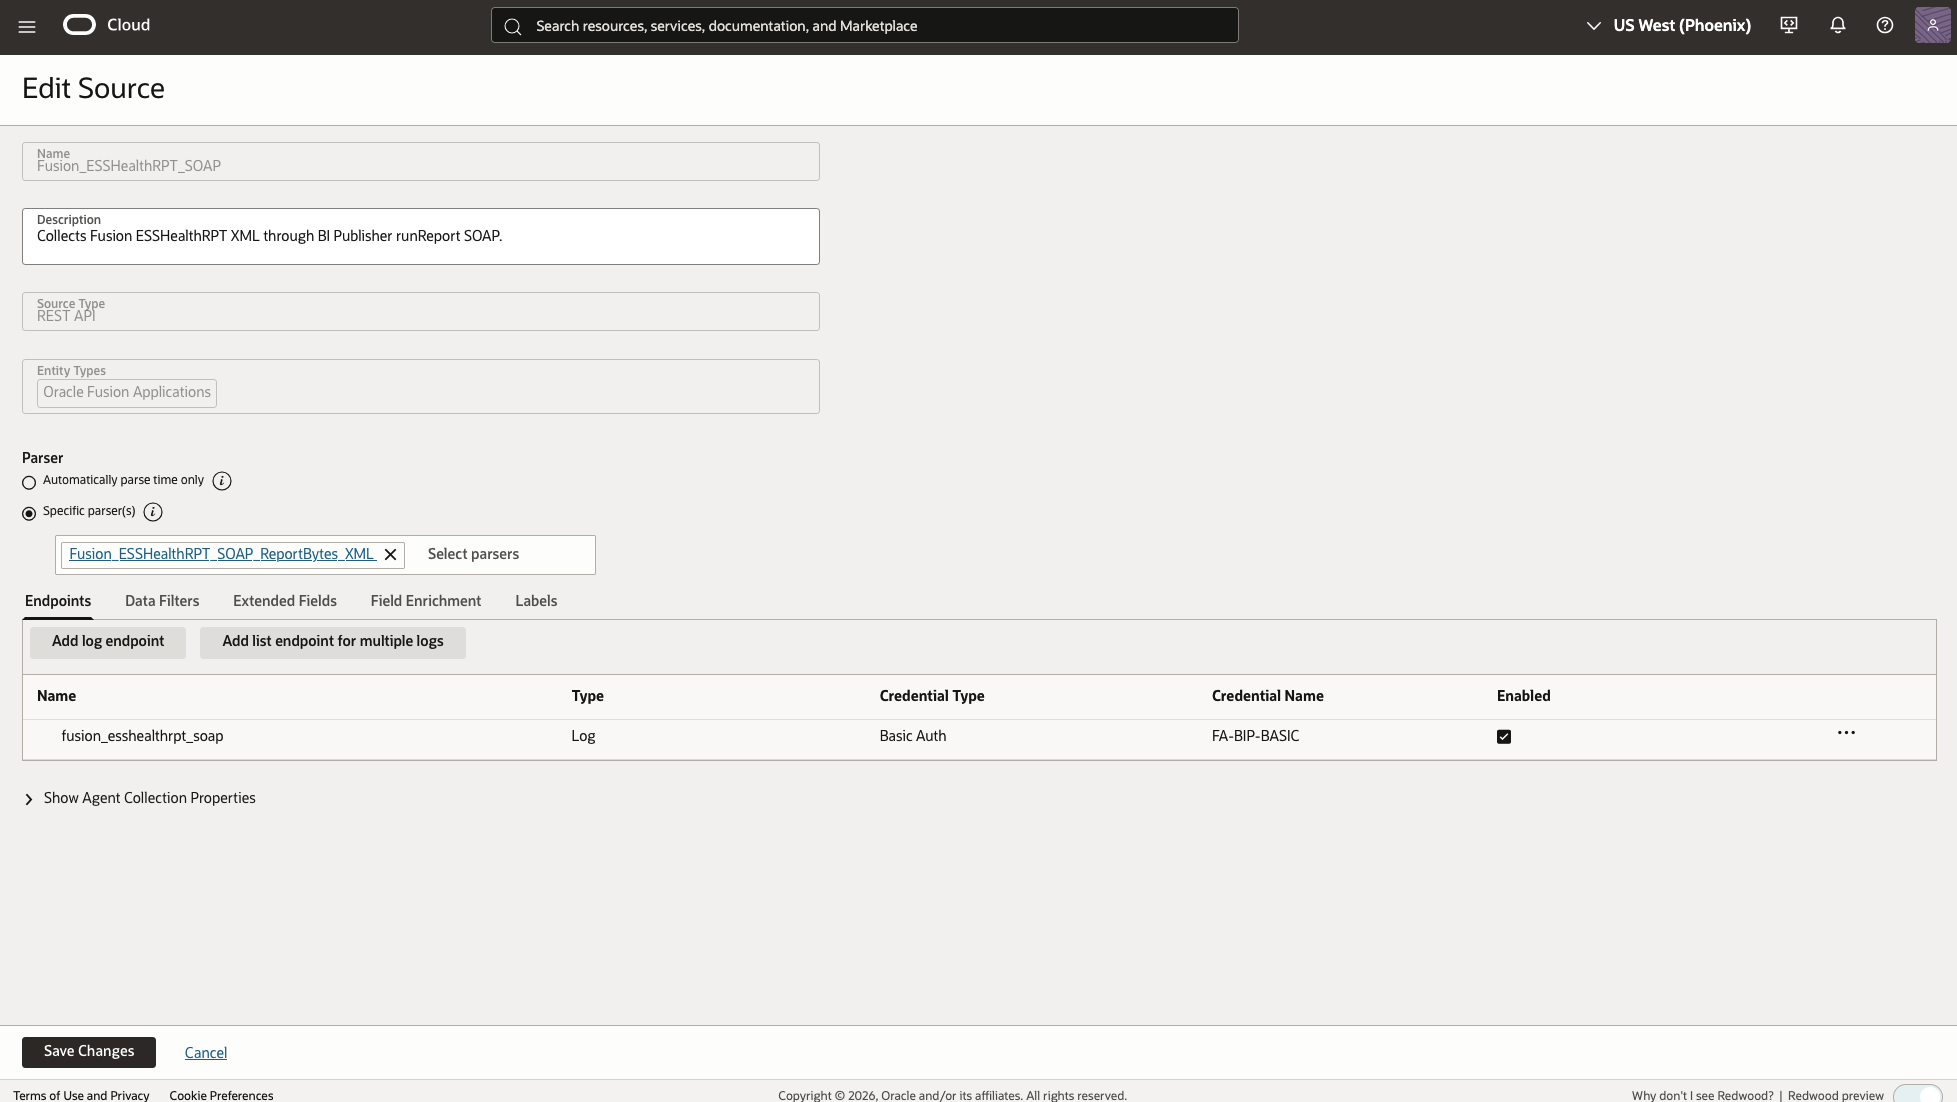
Open the imported source and confirm these settings. The endpoint resolves pod_url from the associated Fusion Applications entity, so the package does not contain a tenant-specific Fusion hostname.
Source type:          REST API
Entity type:          Oracle Fusion Applications
Endpoint name:        fusion_esshealthrpt_soap
Method:               POST
Endpoint URL:         https://{pod_url}/xmlpserver/services/v2/ReportService
Request content type: application/xml
Response content type: application/xml
Credential:           FA-BIP-BASIC
Report path:          /Custom/ESSHealth/ESSHealthRPT.xdo
Collection interval:  10 minutes
The source supplies the report window with these Log Analytics macros:
P_FROM_TIMESTAMP = {START_TIME:yyyy-MM-dd'T'HH:mm:ss.SSS.TZ=UTC}
P_TO_TIMESTAMP   = {CURR_TIME:yyyy-MM-dd'T'HH:mm:ss.SSS.TZ=UTC}
The wrapper parser extracts runReportReturn/reportBytes and invokes the Base64-decoding subparser. The decoded report XML is then passed to Fusion_ESSHealthRPT_Decoded_XML, which creates one Log Analytics record for each /DATA_DS/ROWS/G1 element and maps REQUEST_EVENT_TIME to the Log Analytics Time field.
Step 7: Associate and validate the source
Follow the source-entity association procedure in Step 6 of Part 1:
- In Log Analytics, navigate to Administration, select Entities, and open the
Oracle Fusion Applicationsentity managed by the collection agent. - Edit the Agent Collection Properties. For the first collection, set Historical Data to ten minutes or one hour and set Enable Filter Duplicate Records to
true. - Navigate to Administration, select Sources, and open
Fusion_ESSHealthRPT_SOAP. - Select Unassociated Entities, click Add Association, and select the Fusion Applications entity.
- Select the Log Analytics log group and submit the association.
Start with a bounded historical interval rather than the P30D example in Part 1. A large initial START_TIME range can make the BI Publisher report exceed the Management Agent read timeout.
Confirm that the entity moves to Associated Entities and that its association status is Success.
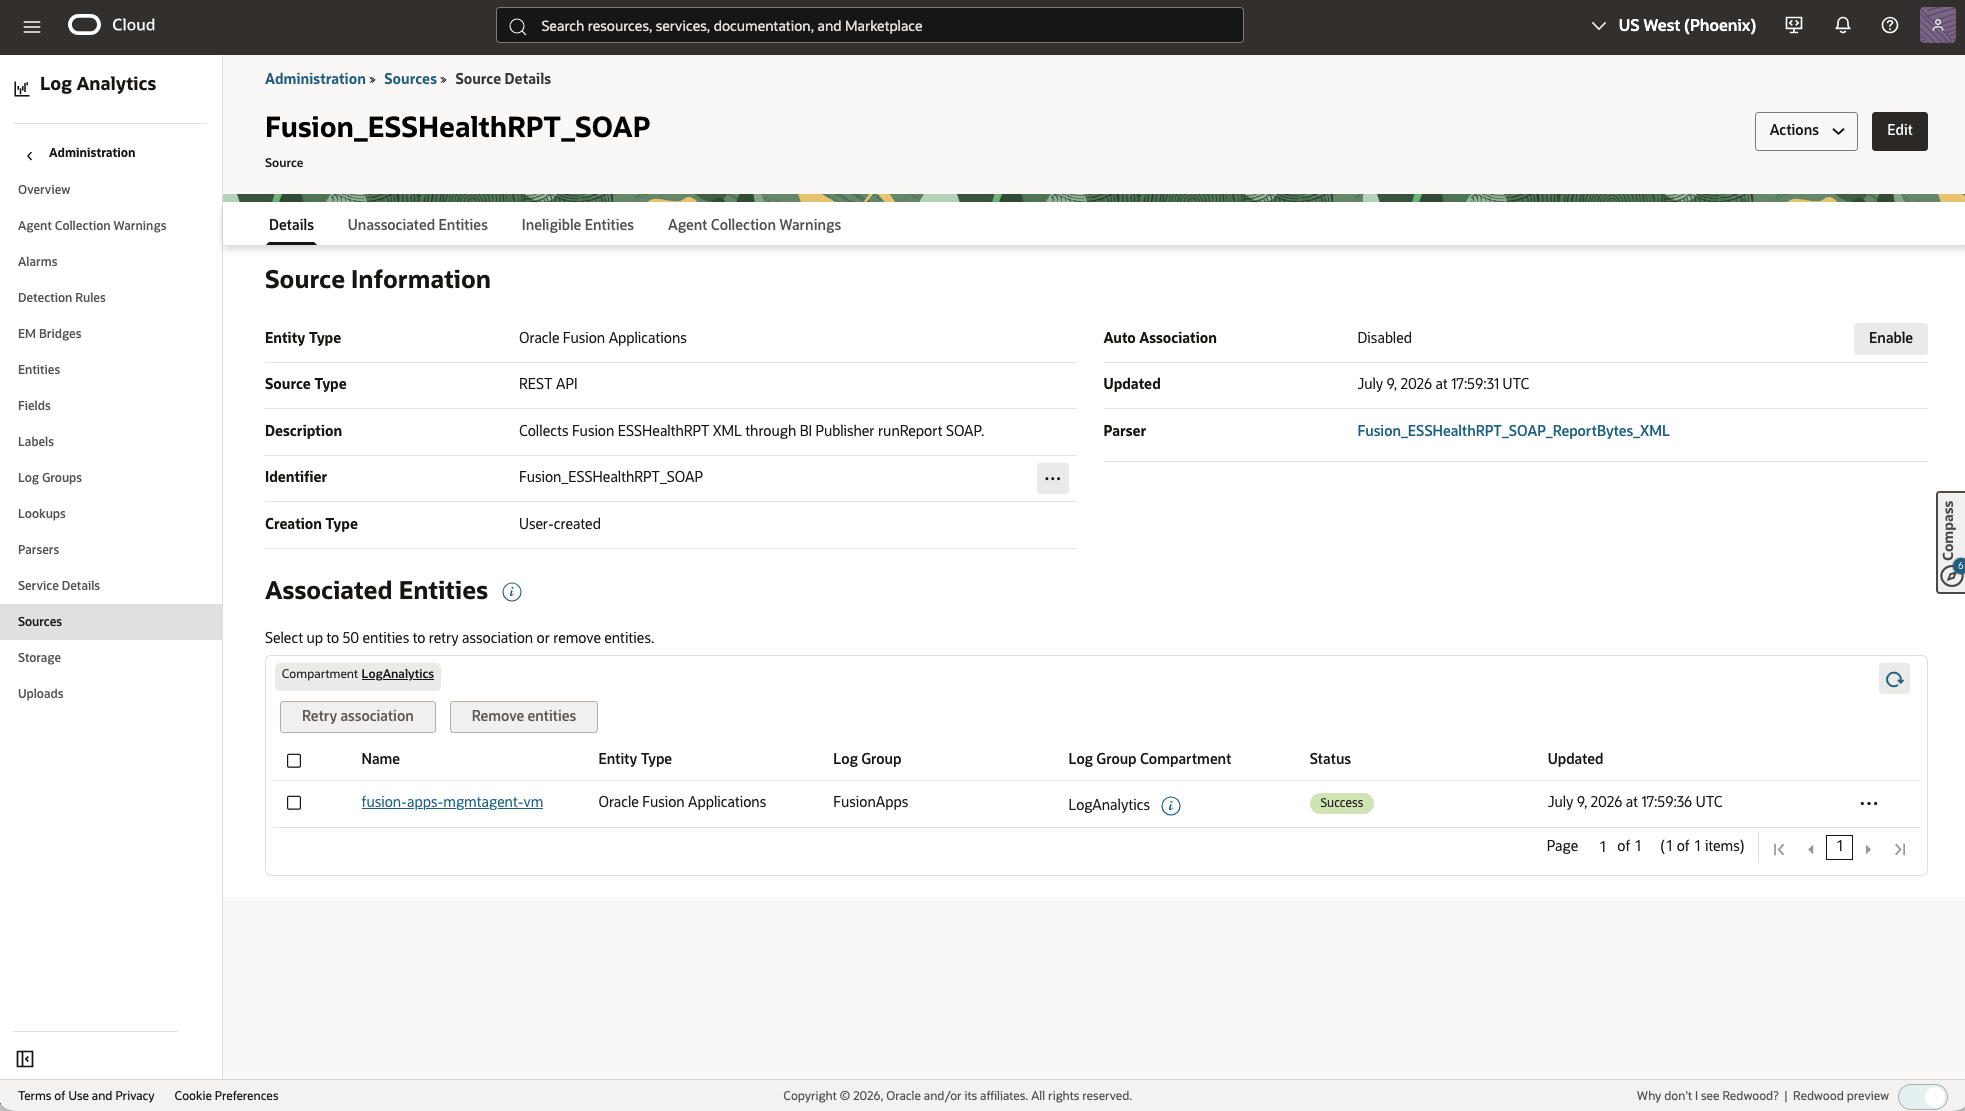
After the first ten-minute collection interval, run:
'Log Source' = Fusion_ESSHealthRPT_SOAP
| timestats count as Records by 'Log Source'
Inspect several parsed records, not only Original Log Content. Compare request IDs, job names, applications, submitters, execution counters, and timestamps with the bounded BI Publisher report output from Step 5.
Step 8: Import the ESS dashboard
In Log Analytics, navigate to:
Dashboards
  -> Overview
  -> Import dashboards
Import Fusion_ESS_Job_Health_Risk_Observatory_SOAP_20260707.json. Select the target compartment for the dashboard and the target compartment for its saved searches, and then select Import.
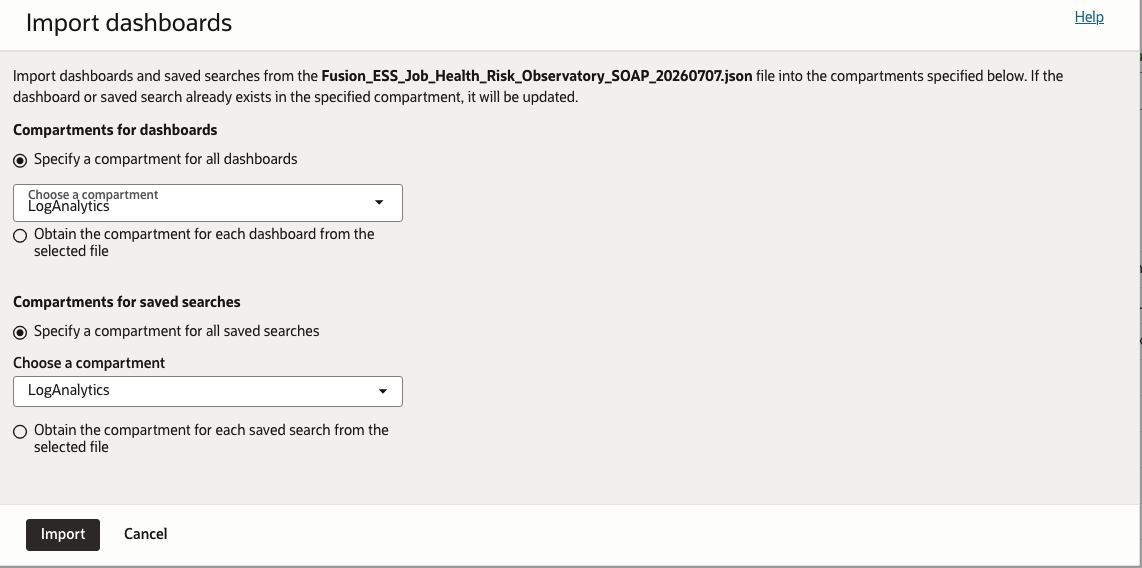
Open Fusion ESS Job Health & Risk Observatory - SOAP and confirm that its widgets return data from Fusion_ESSHealthRPT_SOAP.
To deploy the complementary broad ESS workload dashboard, repeat the import procedure with Oracle_Fusion_Apps_ESS_Analysis_SOAP_20260708.json.
Analyze ESS Workload Distribution and Runtime Behavior
Oracle Fusion Apps Enterprise Scheduler Service (ESS) Analysis - SOAP preserves the broad workload-analysis view introduced in Part 1. The ESS Job Health & Risk Observatory complements it with widgets that help operators move from overall workload health to the jobs, applications, submitters, and time periods that require investigation.
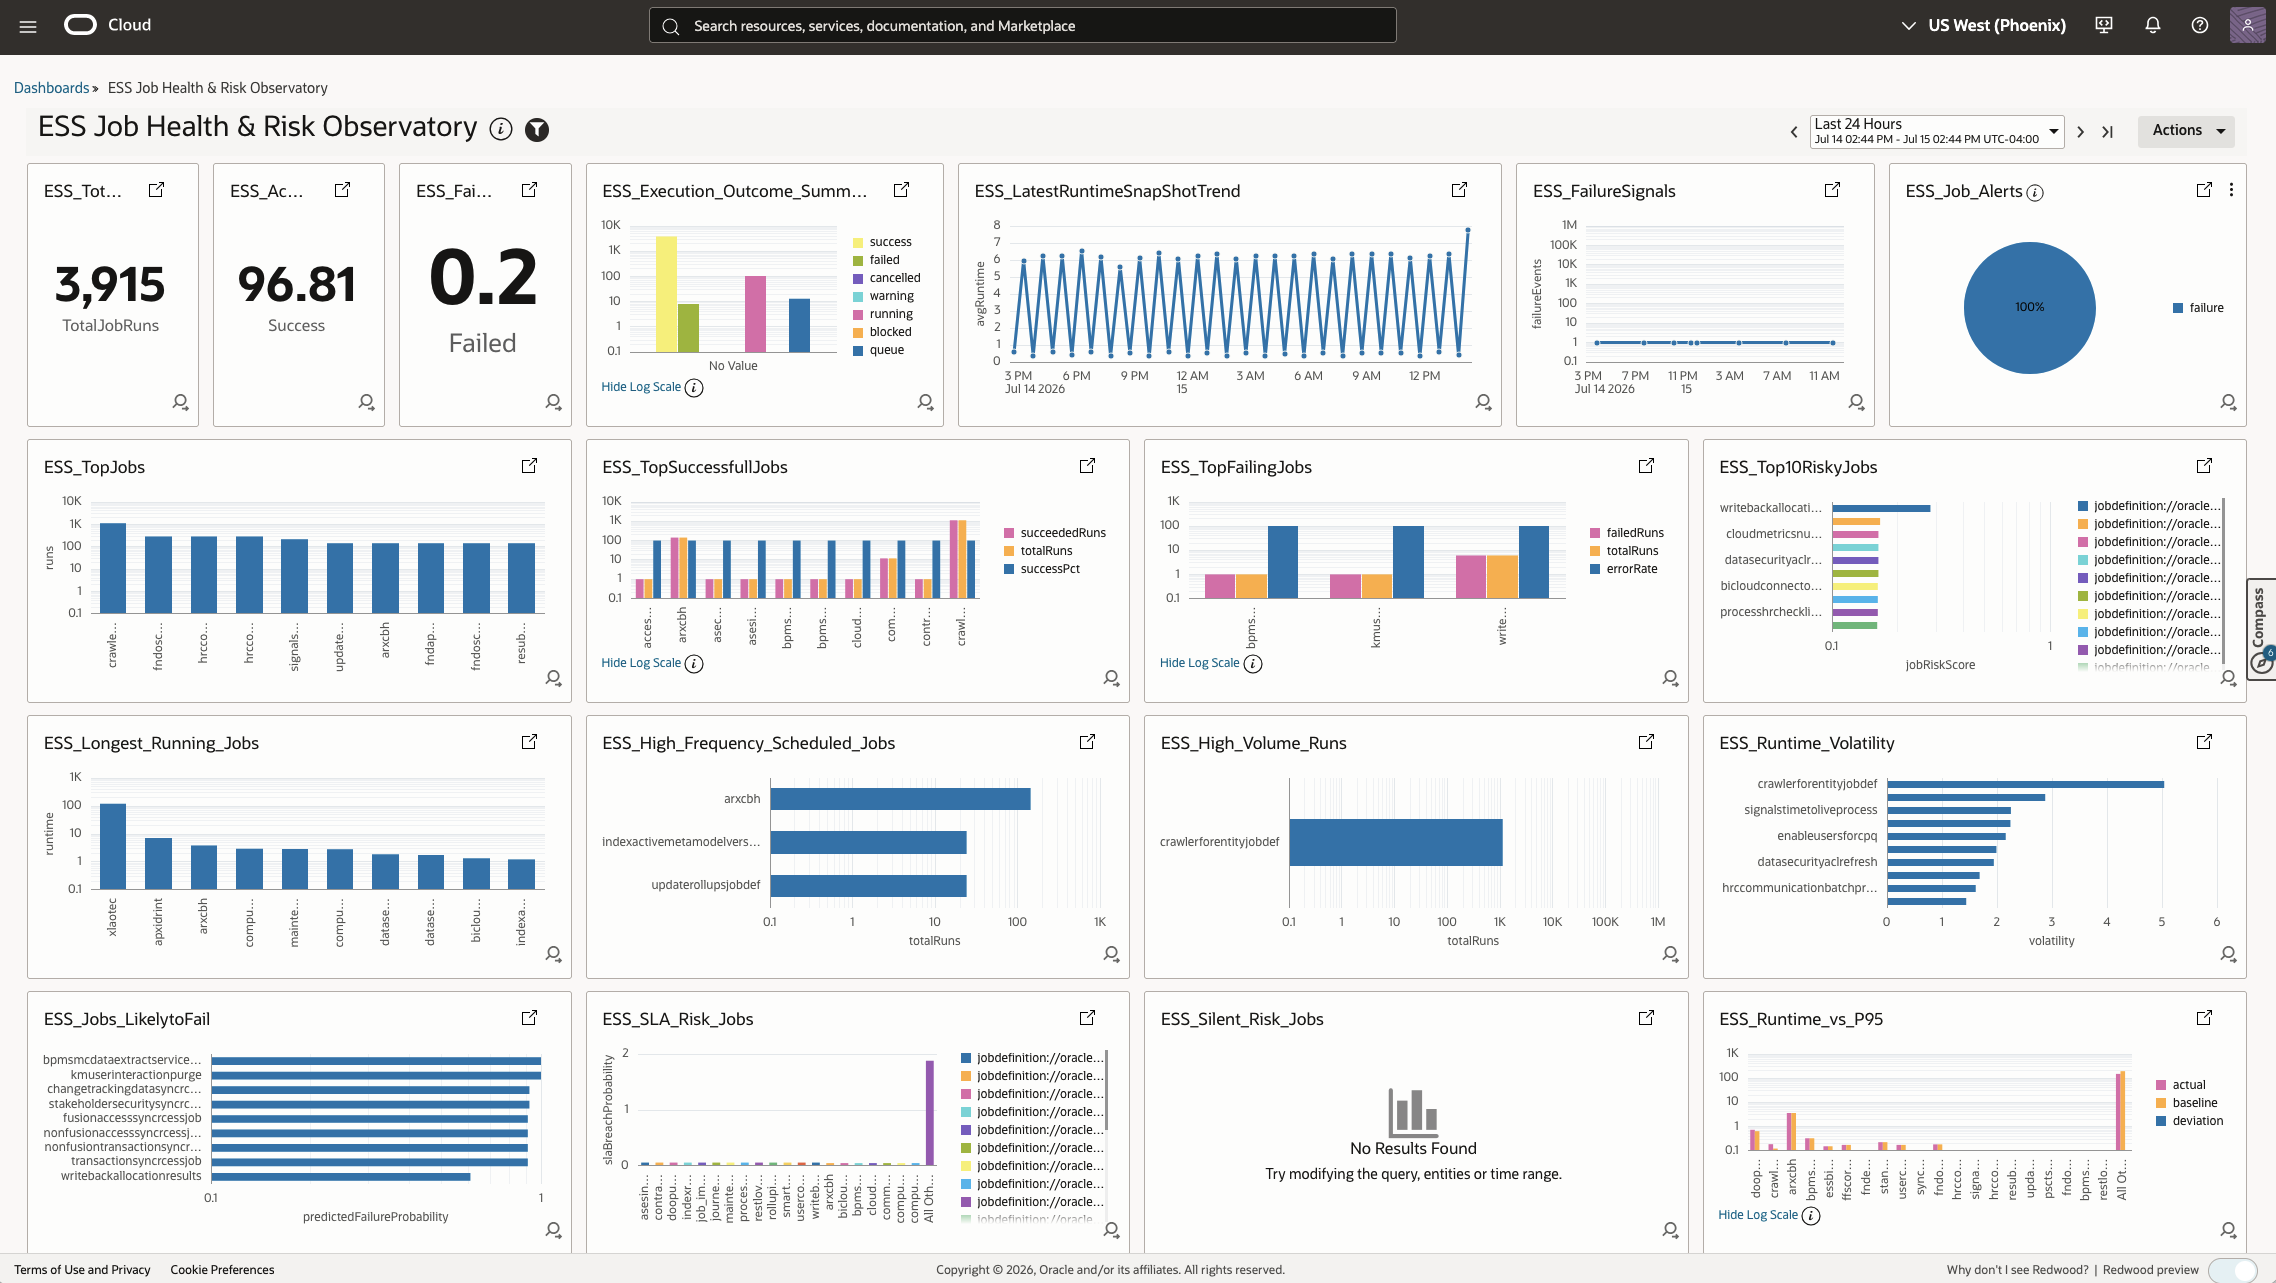
The overview widgets answer four operational questions:
- Is the ESS workload healthy?
ESS_TotalJobRuns, the success and failure indicators,ESS_Execution_Outcome_Summary, andESS_FailureSignalsshow overall execution volume and whether failed, cancelled, running, blocked, or queued work is present. - Which jobs dominate the workload?
ESS_TopJobs,ESS_High_Frequency_Scheduled_Jobs, andESS_High_Volume_Runsidentify frequently executed and high-volume jobs that can have the greatest operational impact. - Which jobs exhibit abnormal runtime behavior?
ESS_LatestRuntimeSnapShotTrend,ESS_Longest_Running_Jobs,ESS_Runtime_Volatility, andESS_Runtime_vs_P95highlight long-running, unstable, or baseline-deviating jobs. - Which jobs should be investigated first?
ESS_TopFailingJobs,ESS_Top10RiskyJobs,ESS_Jobs_LikelytoFail,ESS_SLA_Risk_Jobs, andESS_Job_Alertsbring failure, risk, and SLA signals together for prioritization.
After identifying an unusual workload or runtime pattern, operators can use the distribution widgets to determine where that activity originates.
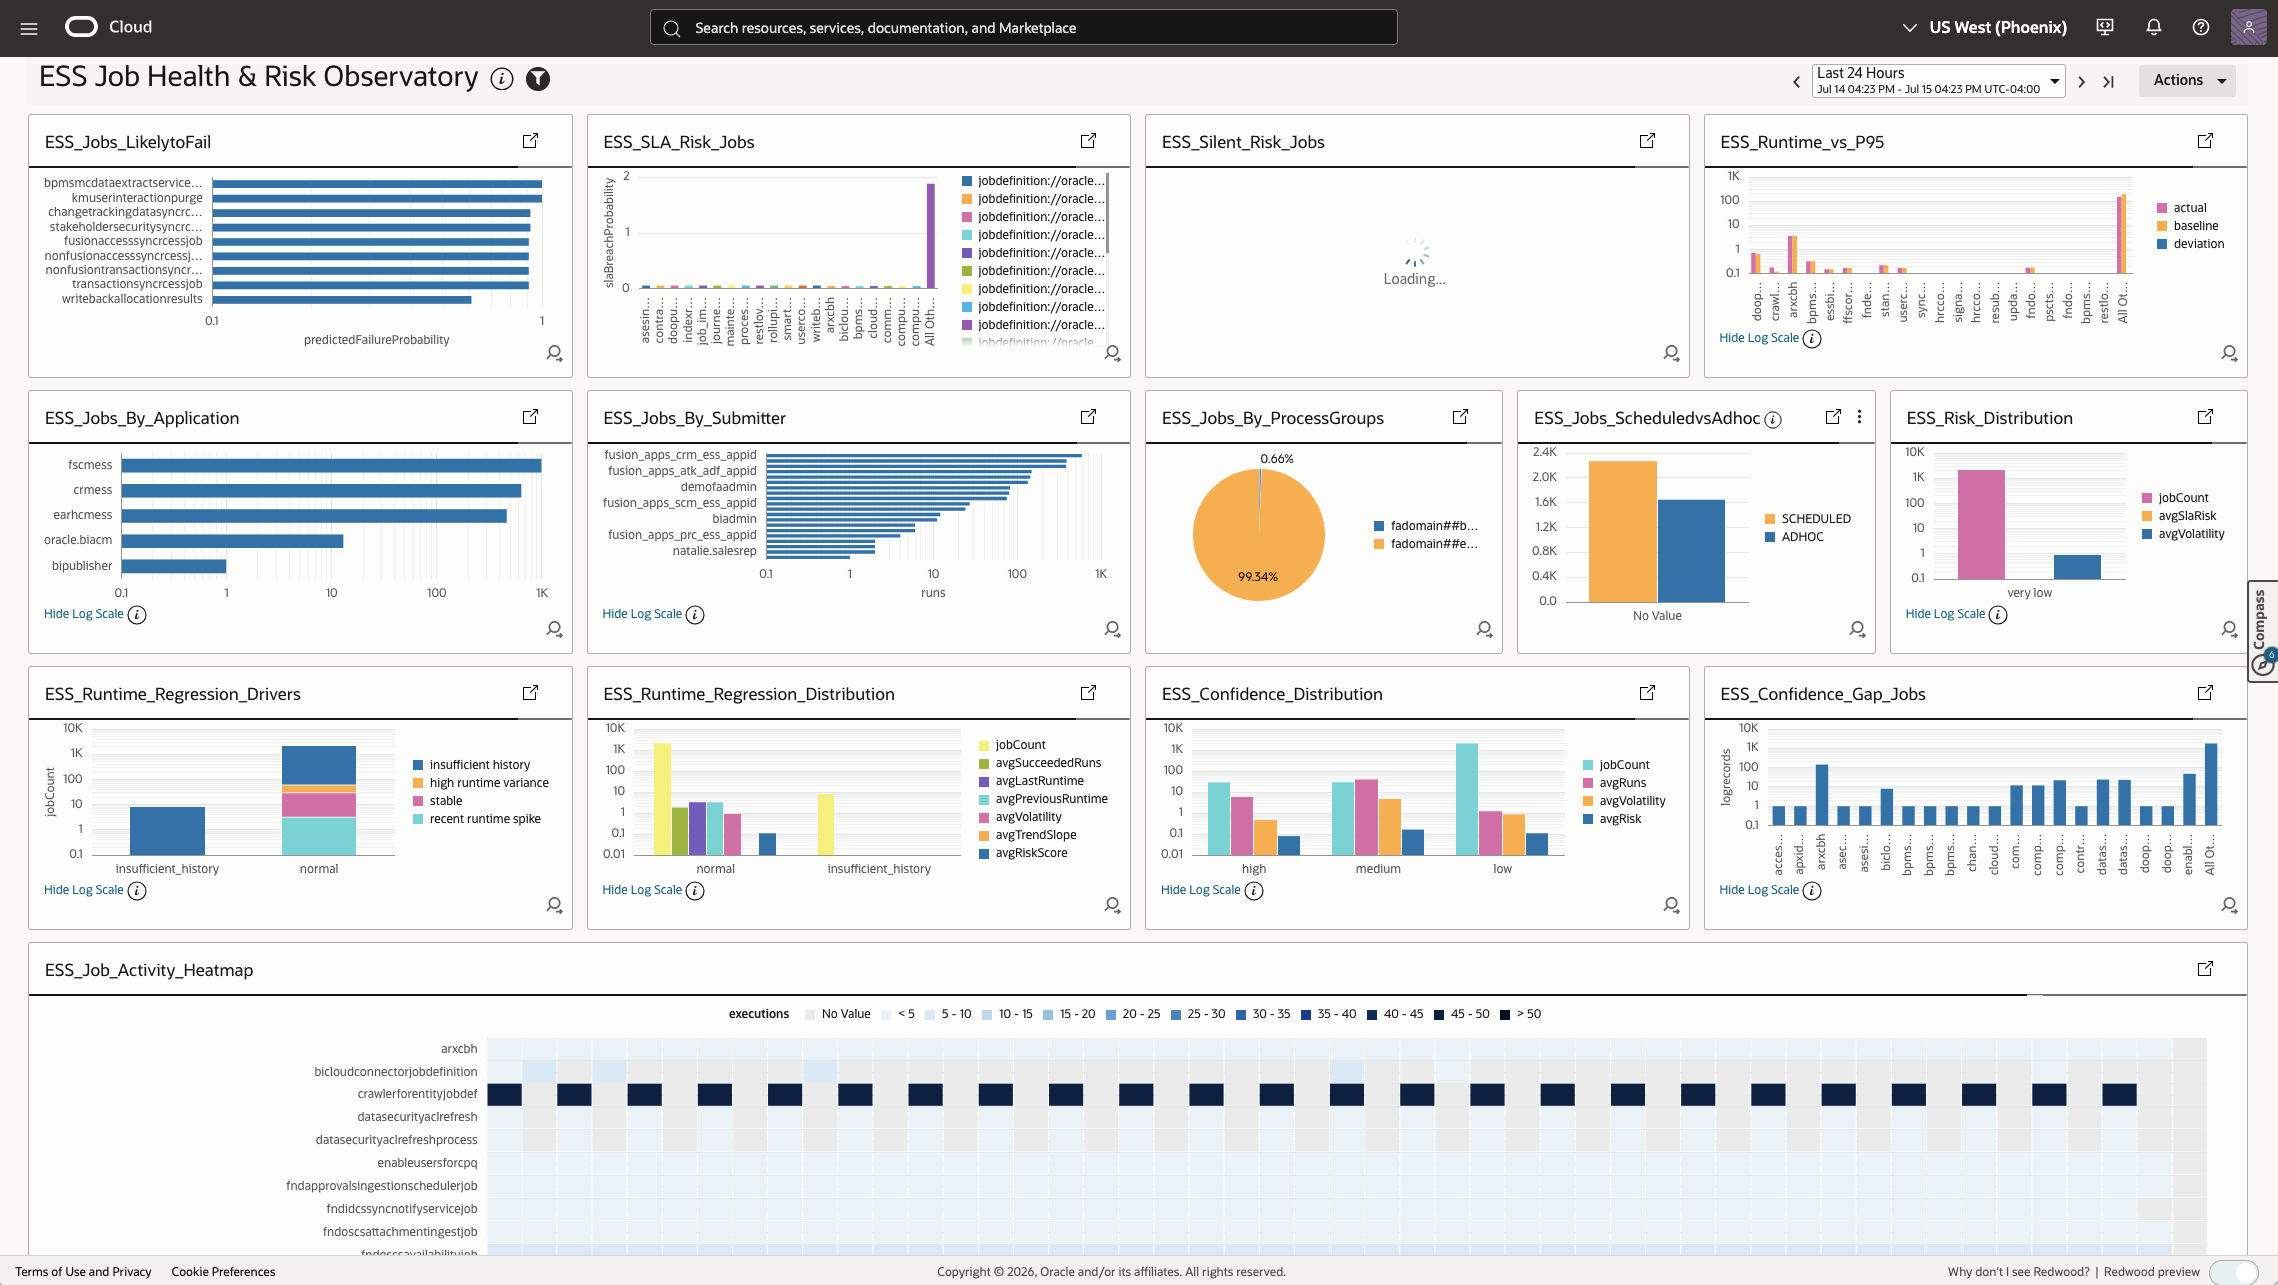
- Locate workload concentration.
ESS_Jobs_By_ApplicationandESS_Jobs_By_ProcessGroupsshow which Fusion Applications and processing groups account for the greatest execution volume. - Identify workload submitters.
ESS_Jobs_By_Submitteridentifies the user or service-account identities submitting the most ESS work. - Compare execution patterns.
ESS_Jobs_ScheduledvsAdhocshows the balance between scheduled and ad hoc activity. - Find recurring workload peaks.
ESS_Job_Activity_Heatmapshows when individual jobs are most active, helping operators recognize recurring peaks and overlapping execution patterns. - Investigate runtime regression signals.
ESS_Runtime_Regression_DriversandESS_Runtime_Regression_Distributiondistinguish observations associated with recent runtime spikes, high runtime variance, stable behavior, or insufficient history. - Assess risk-signal confidence.
ESS_Risk_Distribution,ESS_Confidence_Distribution, andESS_Confidence_Gap_Jobsshow how broadly risk is distributed and where limited execution history may weaken confidence in the calculated signals. - Investigate jobs that remain alerted.
ESS_Active_Alertsshows the latest job-level health record for each alerted job definition, including its current status, recent failures, maximum running duration, severity, alert cause, calculated failure, SLA-breach and stuck-job probabilities, confidence, and request identifiers. A running status alone does not mean that a job is stuck; confirm the signal against its duration, historical baseline, repeated state, and underlying Fusion request.
Together, these widgets provide a practical investigation path: locate workload concentration, identify abnormal runtime behavior, determine the affected application and submitter, and prioritize the jobs that require further analysis.
The activity heatmap represents observed executions rather than configured schedule definitions. Runtime-regression drivers classify the conditions associated with a signal; they do not prove its root cause. Predicted failure probabilities and risk scores are prioritization signals rather than guaranteed outcomes, so operators should confirm the underlying ESS request details before taking corrective action.
For detailed definitions of the report fields, computation scopes, parameters, thresholds, and formulas behind these widgets, see the Report Columns, Query Parameters, and ESS Job Health Signal Calculations sections in Ranveer Tiwari’s ESS Job Health & Risk Observatory article. That article documents the original OIC-based design; use the direct Management Agent SOAP procedure in this article for deployment.
Configure the BI Publisher Report Execution Audit SOAP Collection
The BI Publisher report-execution audit use case reuses the Management Agent, Log Analytics plug-in, Fusion Applications entity, log group, and credential configuration established for ESS monitoring. Only the Fusion audit preparation, Log Analytics source, and dashboard package are different.
-
Prepare BI Publisher auditing. Follow How To Configure And Use Audit In BI Publisher For Fusion SaaS Cloud Customers? (My Oracle Support Doc ID 2059102.1) to enable BI Publisher auditing, install the supplied audit catalog, and configure the audit data source. For this collection, verify that
/Custom/Audit/Data Models/BIP Audit Report DM.xdmis available and can accessAuditViewDB.How To Configure And Use Audit For Usage and Performance In OTBI For Fusion SaaS Cloud Customers (My Oracle Support Doc ID 2731495.1) provides related guidance for OTBI usage and performance monitoring. OTBI usage monitoring is complementary to this BI Publisher report-execution audit source; it does not replace the BI Publisher audit setup.
-
Grant the monitoring account access. Reuse the dedicated Fusion monitoring account and
FA-BIP-BASICcredential configured earlier. Ensure that the account has BI Consumer access, permission to traverse and execute the objects under/Custom/Audit, and access to theAuditViewDBdata source. The ESS Monitor role is required for ESS collection but does not provide BI Publisher audit access by itself. -
Import the BI Publisher audit source. Import
Fusion BIP Audit SOAP_1784581429950.zip. The source preserves the validated implementation: it invokesrunDataModelon/Custom/Audit/Data Models/BIP Audit Report DM.xdm, extracts and Base64-decodesreportBytes, and parses each/DATA_DS/G_1record. Its endpoint useshttps://{pod_url}/xmlpserver/services/v2/ReportService; confirm that the associated Fusion Applications entity provides the correctpod_urlvalue. -
Associate and validate the source. Follow the same source-association process used for
Fusion_ESSHealthRPT_SOAP, associatingFusion BIP Audit SOAPwith the Fusion Applications entity and the appropriate Log Analytics log group. Begin with a bounded collection interval and verify parsed records against known BI Publisher executions. Confirm the execution ID, user, report path, data model, execution type, outcome, start and completion times, cache status, runtime, ECID, and session identifier. -
Import the execution-audit dashboard. Follow the dashboard-import procedure from the ESS workflow and import
Oracle_Fusion_Apps_BIP_Report_Execution_Audit_SOAP_20260710.json. Select the dashboard and saved-search compartments, openOracle Fusion Apps: BI Publisher Report Execution Audit - SOAP, and confirm that its widgets return records fromFusion BIP Audit SOAP.
Analyze BI Publisher Report Execution History by User
Oracle Fusion Apps: BI Publisher Report Execution Audit - SOAP extends the same monitoring pattern to BI Publisher report activity. While the ESS dashboards analyze scheduled-job health and performance, this companion dashboard shows who executed each BI Publisher report, when and how it was executed, whether it succeeded, and how it performed.
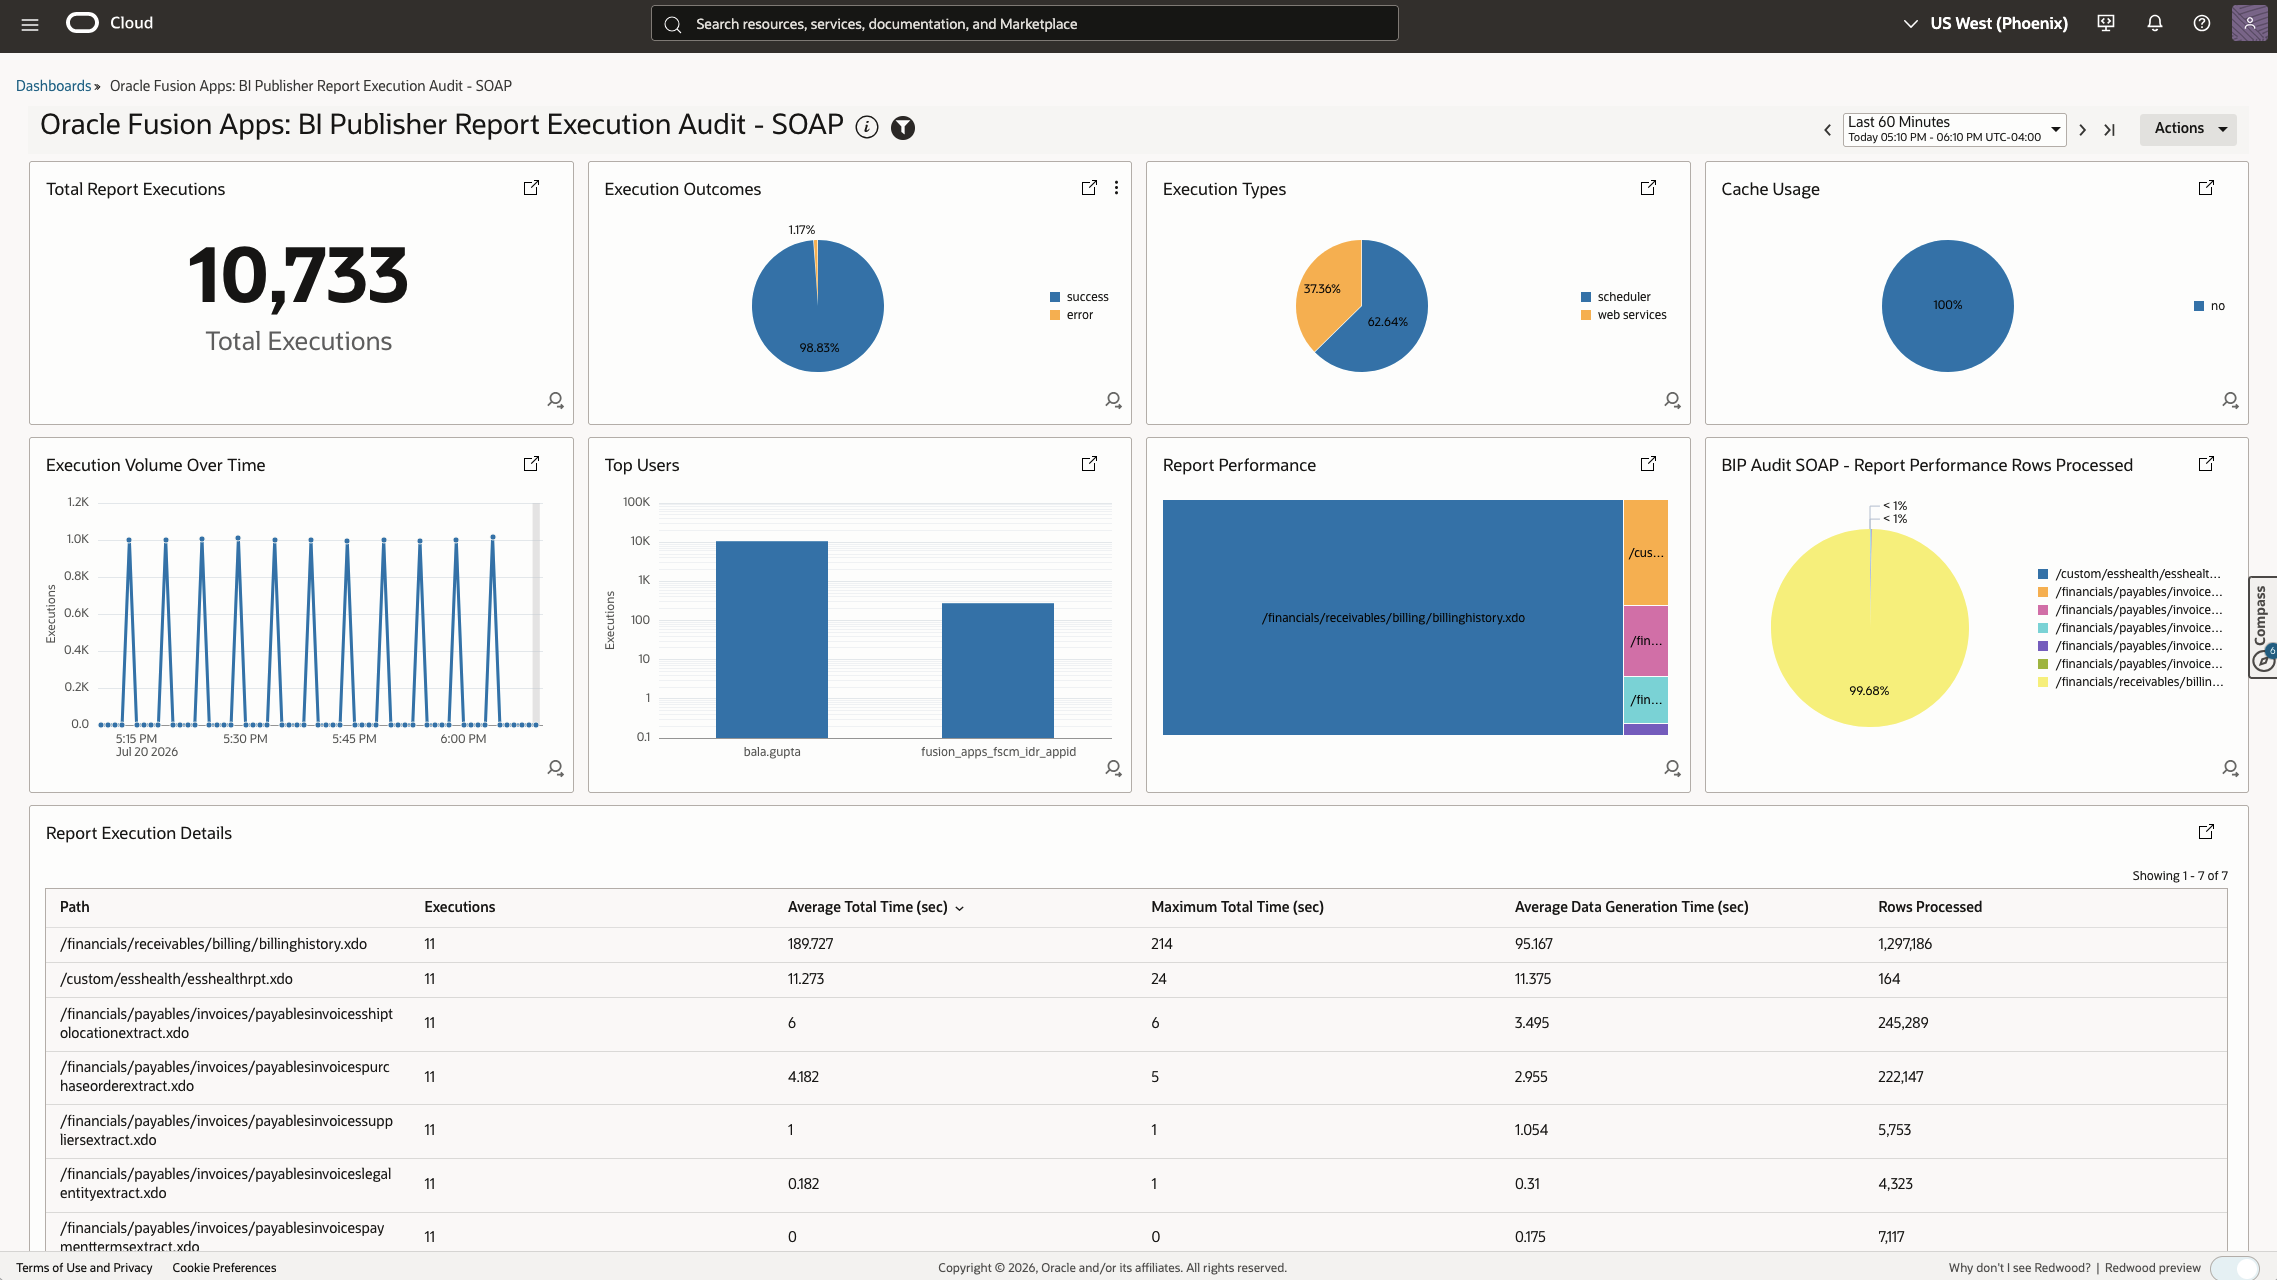
This dashboard represents report-execution history from BIPReportAuditTrail. It does not track changes to report definitions, data models, layouts, permissions, or other BI Publisher catalog objects. Those configuration changes belong to the separate BIPCatalogObjectAuditTrail use case.
The dashboard helps operations and audit teams answer these questions:
- How much BI Publisher activity is occurring? Review total report executions and execution volume over time to identify workload changes or unusual spikes.
- Are report executions succeeding? Compare successful and failed executions to recognize emerging reliability problems.
- Who is executing the reports? Identify the users and service accounts responsible for the greatest report activity.
- How are reports being invoked? Compare executions initiated through Web Services, Scheduler, and other execution types.
- Is the BI Publisher cache being used? Review cache usage to understand whether executions are using cached results or repeatedly regenerating report data.
- Which reports require performance attention? Compare report paths by average and maximum total execution time, data-generation time, and processed-row volume.
- What happened during an individual execution? Review the user, report path, data model, execution type, outcome, start and completion times, cache status, runtime, ECID, and session identifier.
A typical investigation begins with an unexpected increase in execution volume, failures, or runtime. Operators can then identify the affected report paths and users, compare invocation and cache behavior, and open the execution details to isolate individual runs. The ECID and session identifier provide additional context for correlating the execution with other available Fusion Applications and OCI diagnostic data.
Together, these views provide BI Publisher usage, reliability, and performance insights without conflating report execution activity with ESS job health or BI Publisher configuration auditing. The following section describes the collection and aggregation boundaries that must be validated before using these records for completeness or compliance evidence.
Interpret BI Publisher Report Execution Data and Collection Boundaries
Each BI Publisher execution has an ID, which the dashboard treats as the execution identity. If an inclusive polling boundary or collection retry ingests the same execution more than once, the dashboard consolidates those copies before calculating totals and performance measures. This prevents duplicate ingestion from inflating the results, but it cannot recover executions that the source did not return.
Interpret the performance fields according to the BI Publisher payload rather than their generic Log Analytics labels. Total Time is the end-to-end execution time, while Duration is the data-generation time rather than the difference between the start and completion timestamps. Record Count is the number of datasets, Rows Examined is the number of processed rows, and Application Name contains the presentation or layout name. BI Publisher also returns formatting time, but the current source does not map that value.
The source records the report start and completion timestamps, but it does not map the report start timestamp to the canonical Log Analytics Time field. Dashboard time controls and time-based visualizations can therefore follow ingestion time instead of the actual report-execution time.
Collection coverage has two additional boundaries. Each request returns at most 1,000 executions because the source sets P_NUM_ROWS=1000, so a busy polling interval can be truncated. The current audit data model also requires both the report start and completion timestamps to fall within the requested interval. An execution that begins in one non-overlapping polling window and completes in the next can therefore be omitted.
These limitations do not prevent operational investigation, but they matter when interpreting trends and totals. The supplied source and dashboard packages have been validated for their parser, field, and dashboard structure. After deployment, validate a bounded interval against known executions in your Fusion environment. Do not use the dashboard as completeness or compliance evidence until that reconciliation succeeds. Dashboard changes alone cannot recover records excluded by the report data model or collection limit.
Conclusion
Part 1 established continuous, request-level ESS monitoring by using the OCI Management Agent to collect Scheduler REST API data. Customer feedback subsequently showed that some ESS job requests operators expected to investigate were not represented in that collection, leaving gaps when troubleshooting cancelled, long-running, persistently running or blocked, repeatedly failing, runtime-regressing, or potentially stuck jobs.
Ranveer Tiwari’s ESS Job Health & Risk Observatory demonstrated how a custom BI Publisher report could provide broader job activity, windowed execution counters, historical runtime baselines, risk signals, confidence measures, and alert context. Its original collection architecture used OIC to invoke BI Publisher and expose the results for ingestion.
Part 2 introduces a SOAP-compatible configuration of the OCI Log Analytics REST API source. The Management Agent can now invoke BI Publisher ReportService directly, extract reportBytes, invoke a Base64-decoding subparser, and pass the restored XML to the report-specific parser.
The customer and operational value of this enhancement includes:
-
Direct BI Publisher collection: The Management Agent collects BI Publisher report data directly while preserving Ranveer’s custom report, data model, and health-analysis logic. OIC is no longer required solely as a telemetry relay, although it remains appropriate for broader orchestration, transformation, or integration requirements.
-
Offloaded observability analysis: ESS job-performance data and BI Publisher report-execution data are stored in OCI Log Analytics. Historical searches, dashboards, workload analysis, correlations, detections, and alerts operate on this offloaded data instead of repeatedly querying Fusion Applications.
-
Reduced monitoring workload on Fusion Applications: Multiple users, dashboards, and alerts can analyze the same collected records without generating a corresponding BI Publisher report request for every investigation. The scheduled SOAP extraction still consumes some Fusion resources, so collection intervals and report windows should be sized appropriately.
-
Broader operational insight: The additional job metadata and cross-run context help operators identify recurring failures, abnormal runtimes, workload volatility, high-risk jobs, and potentially stuck requests. This helps close the customer-reported ESS monitoring gap.
-
Complementary REST and SOAP coverage: Scheduler REST provides detailed information about an individual ESS request, while BI Publisher SOAP provides job-centric summaries, historical performance baselines, and prioritization signals across multiple executions. SOAP enhances the existing REST-based monitoring approach; it does not replace it.
The same Management Agent and SOAP transport pattern also supports the separate Fusion BIP Audit SOAP use case for analyzing BI Publisher report-execution history by user, invocation type, outcome, cache behavior, and runtime. ESS job performance and BI Publisher execution history remain distinct monitoring concerns that share a common collection and offloaded-analysis pattern.
References
- Fusion Apps Observability by Collecting Enterprise Scheduler ESS Logs Using OCI Logging Analytics REST API Ingestion
- Beyond Monitoring: AI-Driven Fusion ESS Job Health & Risk Observatory
- BI Publisher Audit Reports: A Complete Guide to Set Up BI Publisher Audit Reports for Fusion Applications
- How To Configure And Use Audit In BI Publisher For Fusion SaaS Cloud Customers? (My Oracle Support Doc ID 2059102.1)
- How To Configure And Use Audit For Usage and Performance In OTBI For Fusion SaaS Cloud Customers (My Oracle Support Doc ID 2731495.1)
- Set Up REST API Log Collection
- Create a Parser
- Allow Continuous Log Collection Using Management Agents
Authors
Royce Fu
Master Principal Cloud Architect
Royce Fu is a Master Principal Cloud Architect at Oracle. His technical focus spans Oracle Cloud Infrastructure, OCI Observability and Management, AIOps, Log Analytics, Operations Insights, Database Management, Oracle Database, and enterprise customer architecture.